The London Underground Property Rundown – the most affordable sale and rental spots
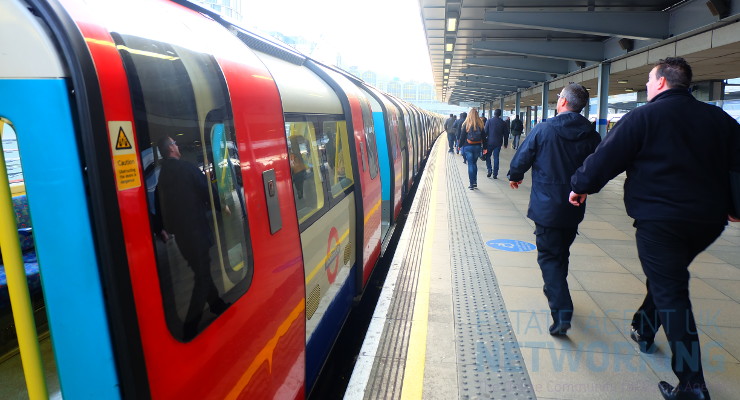
Leading independent London estate agent, Benham and Reeves, has looked at the cost of buying and renting across the London Underground, where is home to the most affordable and unaffordable spots and which line tops the table where the property market is concerned.
Using data from PropertyData.co.uk, Benham and Reeves crunched numbers on thousands of tube stops across the network looking at the average cost of buying and renting in the immediate area surrounding these stops.
By Line
There’s no doubt that a tube stop brings a price premium with the average house price across the 12 tube lines some 83% higher than the London average and the average rent some 34% higher.
For those looking to buy on the London tube network, the new kid on the block offers the most affordable foot on the ladder, with the average house price surrounding the DLR currently at £561,358. The Metropolitan line is the only other line with an average house price below the £700k mark.
The Waterloo and City line tops the table for unaffordability with an average house price of £1.4m, closely followed by the Circle line at £1.2m, the only other line to exceed the £1m mark.
Where rentals are concerned, the Met and DLR swap places to provide the most affordable options with the average monthly rent at £1,698 across the Met line and £1,788 on the DLR. Perhaps surprisingly, the Central line offers the third highest rental affordability of all lines at £1,964 a month.
By Station
When looking at the most affordable stations Barking and neighbouring Upney offer the best buy with an average house price of £309,366, closely followed nearby Dagenham East, Becontree and Dagenham.
For those looking to rent, Watford provides the cheapest option for tenants at £1,079 a month, with Hornchurch, Elm Park, Upminster Bridge and Northolt all ranking high for rental affordability.
The crown for most unaffordable stations where both buying and renting are concerned go to Gloucester Road and South Kensington, both with an average house price of £1.9m and an eye-watering average monthly rent of £4,207.
Director of Benham and Reeves, Marc von Grundherr, commented:
“The London Underground is so heavily entwined with the capital’s property market but we don’t often think what value each line holds from a property perspective. Most of the time, home sellers and landlords will assume a property price premium simply due to the close proximity of an underground station.
However, where buyer and tenant are concerned, there is certainly a preference when it comes to which station, on which line and some are willing to pay way over the odds for the convenience, so it pays to do your research and maximise your properties potential.
Of course, value along the tube network mirrors that of the terrain above with more central lines commanding a higher price tag, but there are plenty of pockets of value to be found on the outer stretches of the Metropolitan Line, the Hammersmith and City line and the Central line for example, where affordability doesn’t mean forsaking a direct link through the heart of the city.”
|
Average House Price by Line
|
Average Rent by Line
|
|||
|
Line
|
Price
|
Line
|
Price
|
|
|
DLR
|
£561,358
|
Metropolitan
|
£1,698
|
|
|
Metropolitan
|
£686,179
|
DLR
|
£1,788
|
|
|
Piccadilly
|
£754,248
|
Central
|
£1,902
|
|
|
Central
|
£755,570
|
Piccadilly
|
£1,964
|
|
|
Hammersmith & City
|
£757,402
|
Jubilee
|
£2,061
|
|
|
Jubilee
|
£778,154
|
Northern
|
£2,109
|
|
|
District
|
£846,131
|
Hammersmith & City
|
£2,131
|
|
|
Northern
|
£856,654
|
Bakerloo
|
£2,177
|
|
|
Victoria
|
£875,470
|
Victoria
|
£2,219
|
|
|
Bakerloo
|
£883,158
|
District
|
£2,221
|
|
|
Circle
|
£1,181,773
|
Waterloo & City
|
£2,782
|
|
|
Waterloo & City
|
£1,405,883
|
Circle
|
£2,848
|
|
|
Top 10 – Lowest average house prices by station
|
|
|
Line
|
Average House Price
|
|
Barking
|
£309,366
|
|
Upney
|
£309,366
|
|
Dagenham East
|
£311,642
|
|
Becontree
|
£315,272
|
|
Dagenham Heathway
|
£315,272
|
|
Heathrow Terminal 5
|
£330,511
|
|
Hatton Cross
|
£330,511
|
|
Heathrow Terminal 4
|
£330,511
|
|
Heathrow Terminals 2 & 3
|
£330,511
|
|
Northolt
|
£341,152
|
|
Top 10 – Lowest average rent by station
|
|
|
Line
|
Average Rent
|
|
Watford
|
£1,079
|
|
Hornchurch
|
£1,200
|
|
Elm Park
|
£1,200
|
|
Upminster Bridge
|
£1,200
|
|
Northolt
|
£1,231
|
|
Hounslow Central
|
£1,235
|
|
Hounslow West
|
£1,235
|
|
Hounslow East
|
£1,235
|
|
Croxley
|
£1,239
|
|
Chorleywood
|
£1,239
|
|
Top 10 – Highest average house prices by station
|
|
|
Line
|
Average House Price
|
|
Gloucester Road
|
£1,934,610
|
|
South Kensington
|
£1,934,610
|
|
High Street Kensington
|
£1,881,258
|
|
Tower Gateway
|
£1,830,176
|
|
Aldgate
|
£1,830,176
|
|
Bank
|
£1,830,176
|
|
Tower Hill
|
£1,830,176
|
|
Green Park
|
£1,792,800
|
|
Bond Street
|
£1,792,800
|
|
Piccadilly Circus
|
£1,792,800
|
|
Top 10 – Highest average rent by station
|
|
|
Line
|
Average Rent
|
|
Gloucester Road
|
£4,207
|
|
South Kensington
|
£4,207
|
|
St. John’s Wood
|
£4,129
|
|
Knightsbridge
|
£3,843
|
|
High Street Kensington
|
£3,518
|
|
Hyde Park Corner
|
£3,432
|
|
Sloane Square
|
£3,432
|
|
Victoria
|
£3,432
|
|
St James’s Park
|
£3,432
|
|
Pimlico
|
£3,432
|


