


Beach hut rental premiums top Kensington and Chelsea for average monthly cost
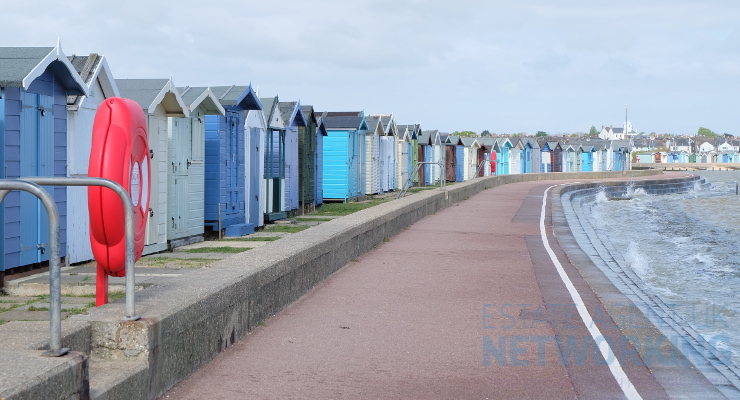
Innovative lettings platform Howsy, has looked at the cost of renting a beach hut in some of the most prestigious spots on the coast and where these eye-watering costs rank in the national rental market.
Howsy looked at the average cost of renting a beach hut across some of the most notoriously expensive and best beach hut locations, including Mudeford, Whitstable, Sandbanks, Southwold and Bournemouth. On average, it costs some £1,486 a month to rent a beach hut in these areas, 42% higher than the national average rent for all properties in England, let alone a room.
To put it into perspective, this is higher than the average rental cost for Ealing, South Bucks, Newham, Guildford and Hounslow to name but a few.
The most expensive is Mudeford, where the average cost of renting a beach hut is a whopping £3,816. This is more than the average monthly rent in Kensington and Chelsea, Westminster, Camden, the City of London and Hammersmith and Fulham!
At an average monthly cost of £1,184, a beach hut in Whitstable costs the same to rent as a house in Winchester, Reigate and Banstead, Spelthorne, Brentwood home of TOWIE and the Vale of Whitehorse and is only marginally lower than Barking and Dagenham.
Sandbanks in Poole is home to the likes of Harry Redknapp and with a beach hut setting you back an average of £920 a month, you could afford to rent in Aylesbury Value and you’re not far off renting in nearby Christchurch.
Finally, the monthly beach hut rental cost of £788 in Southwold would sit between Southampton and Medway in the national rental market, while a Bournemouth beach hut (£720) sits between Northampton and Mid Suffolk.
Founder and CEO of Howsy, Calum Brannan, commented:
“Whether you’re looking to rent or buy, beach hut premiums can be quite outrageous and the sums of money that can be involved for a single hut could secure you an actual rental property in many parts of the UK.
This is all part and parcel of the supply and demand rental dynamic and whether it’s a beach hut, parking space or actual property, if you have the prime asset and location, there will always be someone willing to pay way over the odds to rent it from you. Personally, I’d prefer a deck chair on the beach.”
|
Location
|
Average Rent (per month)
|
|
Brent
|
£1,578
|
|
Barnet
|
£1,548
|
|
Merton
|
£1,542
|
|
Haringey
|
£1,513
|
|
Average (all beach huts)
|
£1,486
|
|
Ealing
|
£1,484
|
|
South Bucks
|
£1,458
|
|
Newham
|
£1,422
|
|
Guildford
|
£1,413
|
|
England
|
£858
|
|
Location
|
Average Rent (per month)
|
|
Mudeford Beach huts
|
£3,816
|
|
Kensington and Chelsea
|
£3,208
|
|
Westminster
|
£2,832
|
|
Camden
|
£2,427
|
|
City of London
|
£2,377
|
|
Hammersmith and Fulham
|
£2,070
|
|
Location
|
Average Rent (per month)
|
|
Cambridge
|
£1,225
|
|
Wokingham
|
£1,220
|
|
Runnymede
|
£1,210
|
|
Barking and Dagenham
|
£1,192
|
|
Whitstable Beach huts
|
£1,184
|
|
Winchester
|
£1,165
|
|
Reigate and Banstead
|
£1,141
|
|
Spelthorne
|
£1,139
|
|
Brentwood
|
£1,139
|
|
Location
|
Average Rent (per month)
|
|
Basingstoke and Deane
|
£933
|
|
Thurrock
|
£931
|
|
Cherwell
|
£926
|
|
Christchurch
|
£924
|
|
Sandbanks Beach huts
|
£920
|
|
Aylesbury Vale
|
£918
|
|
Adur
|
£905
|
|
Solihull
|
£898
|
|
Fareham
|
£891
|
|
Location
|
Average Rent (per month)
|
|
Worthing
|
£807
|
|
Bedford
|
£802
|
|
Ashford
|
£797
|
|
Southampton
|
£793
|
|
Southwold Beach huts
|
£788
|
|
Medway
|
£788
|
|
Norwich
|
£787
|
|
South Hams
|
£786
|
|
North Dorset
|
£785
|
|
Location
|
Average Rent (per month)
|
|
Lichfield
|
£727
|
|
Moray
|
£723
|
|
Broadland
|
£723
|
|
Aberdeen
|
£723
|
|
Bournemouth Beach huts
|
£720
|
|
Northampton
|
£718
|
|
Newcastle upon Tyne
|
£717
|
|
Birmingham
|
£715
|
|
Teignbridge
|
£712
|
|
Sources:
|
|
|
Beach hut house prices
|
|
|
Rents data
|
|
You May Also Enjoy
What to know when buying land
Tenant demand strong, landlord supply shrinking

Why Join a Letting Agents Association?

House price growth remained subdued in July
