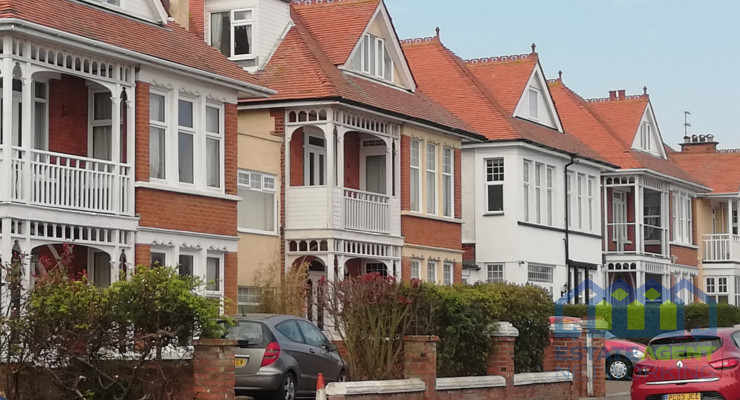
Bexley badly in need of new build housing stock
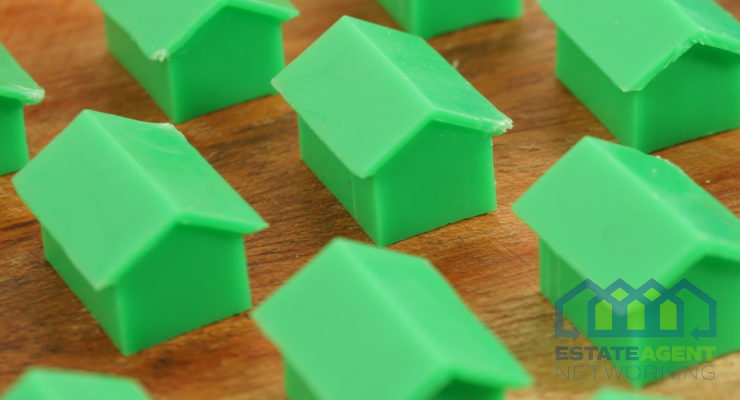
The latest research by new homes specialists, Stone Real Estate, has looked at where across London is home to the greatest proportion of new build housing stock, as well as where is home to the largest levels of homebuyer demand when it comes to new builds.
Stone Real Estate looked at what proportion of homes listed on the major property portals were new build as a percentage of all stock listed, as well as the boroughs with highest demand based on the largest number of new build properties already listed as sold.
The research shows that demand for new build housing across London as a whole currently sits at 15.6%, while the number of new build homes listed for sale as a percentage of all properties is just 9.8%.
Bad news for Bexley
With just 2.5% of all stock currently listed as new builds, Bexley is home to the lowest level of new homes in the capital. However, when it comes to the small amount of new build stock that is available, buyer demand is currently the second-highest in London at 34.4%, demonstrating a real thirst for new build homes despite the lack of delivery.
Lowest stock levels
Other boroughs to rank with some of the lowest levels of new build stock are Redbridge (3.1%), Kensington and Chelsea (4%), Waltham Forest (4.2%) and Richmond (4.3%).
The City of London is home to the highest level of new homes with 29.9% of all stock listed for sale falling into the category. Tower Hamlets also ranks high at 23.6%, with Hackney (19.8%), Newham (15.9%) and Lambeth (14.7%) home to a good amount of new build stock.
Highest demand levels
The only borough to see a higher level of homebuyer demand for new build homes is Bromley with 40% of all new build homes already listed as sold. Sutton (30.2%), Kingston (26.9%) and Waltham Forest (26.8%) were also home to a large appetite for new builds.
While the City of London is home to the largest proportion of new build stock, it’s also home to the lowest level of new build homebuyer demand, with just 3.4% of all new builds listed marked as sold.
Westminster was the second-lowest at 7.7% and again, while Hackney and Tower Hamlets are home to some of the highest levels of new build stock, they also ranked low for buyer demand at 8.3% and 8.9% respectively.
Founder and CEO of Stone Real Estate, Michael Stone, commented:
“There’s no denying that we are in desperate need of more housing across the capital and a large proportion of that needs to be affordable, a factor that can often be overlooked when trying to balance the books.
While house building is a complex task and certainly can’t be done overnight, the data does suggest that perhaps some of our new build efforts across the capital have been poorly targeted and in fact, some of the areas with the lowest level of new homes are the areas where buyers are crying out for them.
It really is vital that we address the current housing crisis but we do so in a sensible manner to ensure that what we are building is available to those that need it, and doesn’t spend months languishing on the portals due to an unobtainable price tag, or a lack of buyer appetite.”
|
New build stock levels as a percentage of all housing stock listed
|
|
|
Location / borough
|
% of NB Properties
|
|
Bexley
|
2.5%
|
|
Redbridge
|
3.1%
|
|
Kensington and Chelsea
|
4.0%
|
|
Waltham Forest
|
4.2%
|
|
Richmond upon Thames
|
4.3%
|
|
Havering
|
5.0%
|
|
Sutton
|
5.3%
|
|
Bromley
|
5.3%
|
|
Enfield
|
5.7%
|
|
Kingston upon Thames
|
5.8%
|
|
Lewisham
|
6.3%
|
|
Barking and Dagenham
|
6.6%
|
|
Haringey
|
7.3%
|
|
Merton
|
7.8%
|
|
Brent
|
7.9%
|
|
Harrow
|
8.6%
|
|
Westminster
|
9.1%
|
|
Hounslow
|
9.4%
|
|
Hillingdon
|
9.6%
|
|
Hammersmith and Fulham
|
10.0%
|
|
Greenwich
|
10.0%
|
|
Ealing
|
11.3%
|
|
Barnet
|
11.4%
|
|
Croydon
|
11.8%
|
|
Camden
|
12.2%
|
|
Islington
|
13.0%
|
|
Wandsworth
|
13.2%
|
|
Southwark
|
13.6%
|
|
Lambeth
|
14.7%
|
|
Newham
|
15.9%
|
|
Hackney
|
19.8%
|
|
Tower Hamlets
|
23.6%
|
|
City of London
|
29.9%
|
|
London
|
9.8%
|
|
New build demand levels of sold stock as a percentage of all stock listed
|
|
|
Location / borough
|
Demand
|
|
Bromley
|
40.0%
|
|
Bexley
|
34.4%
|
|
Sutton
|
30.2%
|
|
Kingston upon Thames
|
26.9%
|
|
Waltham Forest
|
26.8%
|
|
Havering
|
25.8%
|
|
Merton
|
23.7%
|
|
Croydon
|
23.6%
|
|
Hillingdon
|
22.6%
|
|
Redbridge
|
20.5%
|
|
Haringey
|
20.1%
|
|
Lewisham
|
19.8%
|
|
Ealing
|
17.3%
|
|
Barking and Dagenham
|
16.9%
|
|
Hounslow
|
16.7%
|
|
Brent
|
16.7%
|
|
Wandsworth
|
16.2%
|
|
Islington
|
15.9%
|
|
Southwark
|
15.7%
|
|
Richmond upon Thames
|
15.5%
|
|
Harrow
|
15.2%
|
|
Greenwich
|
14.7%
|
|
Barnet
|
13.1%
|
|
Lambeth
|
12.7%
|
|
Enfield
|
11.5%
|
|
Kensington and Chelsea
|
11.3%
|
|
Newham
|
11.0%
|
|
Hammersmith and Fulham
|
10.2%
|
|
Camden
|
9.7%
|
|
Tower Hamlets
|
8.9%
|
|
Hackney
|
8.3%
|
|
Westminster
|
7.7%
|
|
City of London
|
3.4%
|
|
London
|
15.6%
|
You May Also Enjoy

Housing Insight Report: May 2026
Breaking Property News 28/7/26

No-deposit mortgages could cost first-time buyers
Beach hut values fall for second consecutive year
Burnham’s property and land tax: what would it mean for property owners?