Constituency house price performance since the last election
Leading estate agent comparison website, GetAgent.co.uk, has looked at how house prices have fared across England and Wales since the last election by individual constituency and which party has seen the largest increase across their respective constituencies as a whole.
House Price Growth by Party
GetAgent.co.uk looked at house price growth by constituency and the party within that constituency since the last election in June 2017 and found that constituencies across the big two of Labour and the Conservatives have seen the best level of house.
The Conservatives top the table with house prices across all Conservative constituencies increasing 5.3% to an average of £278,360 today, while Labour came in second with a 5.1% increase.
The Liberal Democrats trail with the lowest rate of house price growth since the last election across all constituencies (3.3%), while constituencies with independent or other parties in power have seen an increase of 4.9%.
Best Performing Constituencies
Political party aside, the best performing constituencies for house price growth since the last election are: –
- Birmingham Ladywood: 23.3%
- Leicester South: 21%
- Brent North: 19.5%
- Sedgefield: 18.2%
- Barnsley Central: 18.2%
Worst Performing Constituencies
At the other end of the political house price spectrum the worst performing areas are: –
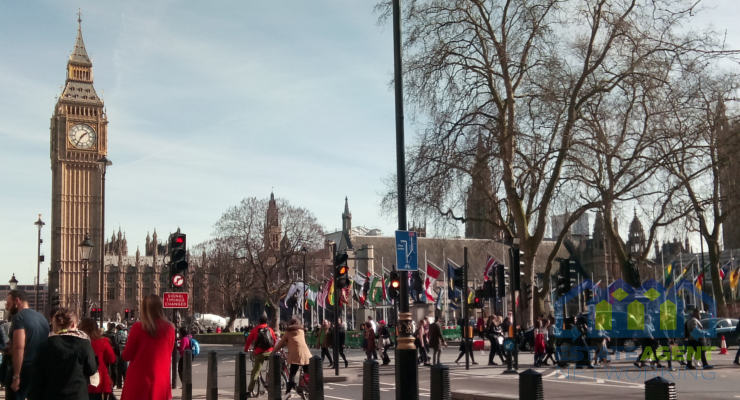
- Cities of London and Westminster: -10.8%
- Hornsey and Wood Green: -8.5%
- Lancaster and Fleetwood: -6.9%
- Richmond Park: -6.3%
- Putney: -6.1%
Founder and CEO of GetAgent.co.uk, Colby Short, commented:
“As we gear up for another general election we thought it would be interesting to see which areas have bucked the wider trend of market uncertainty to register the best levels of house price growth since the last one.
When it comes to wider political house price performance the data shows it’s a very mixed bag and while Labour hold 14 out of the best 20 performing constituencies for house price growth, they also hold 11 of the worst 20 as well, although the Lid Dems seem to the worst party for UK homeowners across the board.”
|
Political Party – Average house prices and change
|
|||
|
Political Party
|
Average House Price (June 2017)
|
Average House Price (latest March 2019)
|
Average change / growth (2017 to 2019) %
|
|
Conservative
|
£264,474
|
£278,360
|
5.3%
|
|
Labour
|
£217,432
|
£228,501
|
5.1%
|
|
Other
|
£255,320
|
£267,776
|
4.9%
|
|
Liberal Democrats
|
£324,295
|
£335,108
|
3.3%
|
|
Constituency Region – by average house price change
|
|||
|
Region
|
Average House Price (June 2017)
|
Average House Price (latest March 2019)
|
Average change / growth (2017 to 2019) %
|
|
East Midlands
|
£173,997
|
£190,187
|
9.3%
|
|
West Midlands
|
£178,732
|
£195,351
|
9.3%
|
|
South West
|
£239,666
|
£255,538
|
6.6%
|
|
North West
|
£155,189
|
£164,887
|
6.2%
|
|
Wales
|
£146,650
|
£155,799
|
6.2%
|
|
Yorkshire and the Humber
|
£154,597
|
£163,330
|
5.6%
|
|
East of England
|
£284,093
|
£299,943
|
5.6%
|
|
South East
|
£324,016
|
£337,917
|
4.3%
|
|
North East
|
£136,949
|
£141,772
|
3.5%
|
|
London
|
£498,332
|
£509,498
|
2.2%
|
|
Constituencies – by best house price growth (%)
|
||
|
Constituency
|
Party
|
Change / growth (June 2017 – now)
|
|
Birmingham Ladywood
|
Labour
|
23.3%
|
|
Leicester South
|
Labour
|
21.0%
|
|
Brent North
|
Labour
|
19.5%
|
|
Sedgefield
|
Labour
|
18.2%
|
|
Barnsley Central
|
Labour
|
18.2%
|
|
Rugby
|
Conservative
|
17.7%
|
|
Forest of Dean
|
Conservative
|
17.1%
|
|
Coventry North East
|
Labour
|
16.8%
|
|
Stoke-on-Trent Central
|
Labour
|
15.8%
|
|
South Swindon
|
Conservative
|
15.6%
|
|
Stockport
|
Other
|
15.4%
|
|
Cynon Valley
|
Labour
|
15.4%
|
|
Torfaen
|
Labour
|
15.4%
|
|
Gedling
|
Labour
|
15.3%
|
|
Halesowen and Rowley Regis
|
Conservative
|
15.1%
|
|
Manchester Withington
|
Labour
|
15.1%
|
|
Harborough
|
Conservative
|
14.9%
|
|
Walsall South
|
Labour
|
14.8%
|
|
Birmingham Yardley
|
Labour
|
14.7%
|
|
Birmingham Erdington
|
Labour
|
14.5%
|
|
Constituencies – by worst house price growth (%)
|
||
|
Constituency
|
Party
|
Change / growth (June 2017 – now)
|
|
Cities of London and Westminster
|
Conservative
|
-10.8%
|
|
Hornsey and Wood Green
|
Labour
|
-8.5%
|
|
Lancaster and Fleetwood
|
Labour
|
-6.9%
|
|
Richmond Park
|
Conservative
|
-6.3%
|
|
Putney
|
Other
|
-6.1%
|
|
Newcastle upon Tyne Central
|
Labour
|
-5.6%
|
|
Liverpool Walton
|
Labour
|
-5.4%
|
|
Battersea
|
Labour
|
-4.8%
|
|
Finchley and Golders Green
|
Conservative
|
-4.7%
|
|
Hull West and Hessle
|
Labour
|
-4.2%
|
|
Swansea East
|
Labour
|
-4.2%
|
|
Chorley
|
Labour
|
-4.1%
|
|
Don Valley
|
Labour
|
-3.4%
|
|
Maidenhead
|
Conservative
|
-3.2%
|
|
Runnymede and Weybridge
|
Other
|
-2.7%
|
|
South Cambridgeshire
|
Lib Dem
|
-2.6%
|
|
Woking
|
Conservative
|
-2.5%
|
|
North East Hampshire
|
Conservative
|
-2.4%
|
|
City of Durham
|
Labour
|
-2.0%
|
|
Ealing Southall
|
Labour
|
-1.8%
|
You May Also Enjoy
UK house prices sit above pandemic market peak
Energy efficient upgrades now an essential home feature

Inverclyde crowned Britain’s most affordable place for first-time buyers
Fewer than 3% of London rental homes available
Cottagecore Design