Here’s where homes are making and losing a year’s salary in annual price growth/decline
Estate agent comparison site, GetAgent.co.uk, has looked at how current market conditions have impacted homeowners financially over the last year and how house price growth compares to the average income.
GetAgent.co.uk used house price data from the latest UK house price index and the latest data from the ONS employee earnings in the UK to compare the net wage across the UK with the change in house price values.
The data shows that there are four areas of the UK where houses have earned their owners the average wage for the area, and then some, despite the remaining prevalence of Brexit uncertainty.
The best place to live in the UK over the last year is North Devon, with the average house price increasing from £221,095 to £245,504 in the last year – a jump of £24.410. This jump is £5,810 more than the average annual net income of £18,599 and a 131% wage increase for homeowners in the area.
The Derbyshire Dales is the second best place with annual house price growth at £31,058 compared to an average wage of £24,796. In the Cotswolds, homeowners have seen property prices increase £28,917, while the average wage is just £24,641.
Purbeck is the fourth and final area of the UK to see house price growth higher than the average wage, with prices up £20,847 compared to a wage of £18,145. Forest Heath, Rochford, Forest Dean, Blaenau Gwent, Redditch and Harborough have also made their owners between 77% and 90% of the average salary in a year.
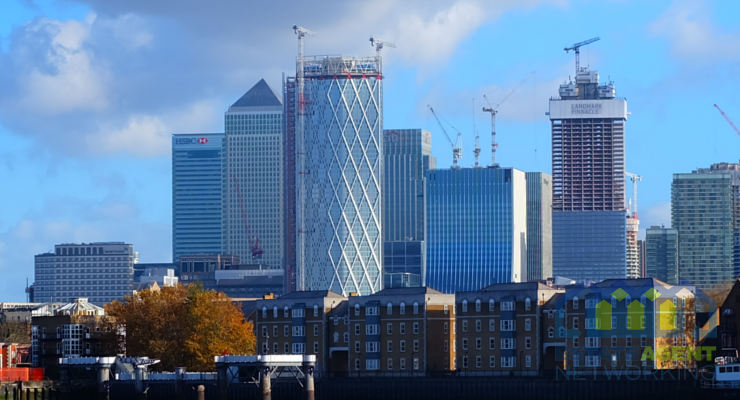
London house prices have fallen by nearly £6,000 in the last year, 18% of the average wage in the capital. However, if you live in Haringey, Southwark or Camden, look away now.
The three London boroughs are the only areas to have seen prices plummet by more than the average wage in the borough. Haringey has seen a drop of £43,906 in the last year with an average wage of just £27,346. Prices in Southwark have dropped £42,822 compared to a wage of £29,191 and Camden has seen a drop of £52,063 with a wage of £43,244.
Eight other London boroughs have seen 50% or more of the average annual wage wiped off by house price decline in the last year and outside of London this stretches to another 13 areas. The worst of which is Tandridge where prices have dropped by £8,922, 71% of the average wage yearly (£31,067).
Founder and CEO of GetAgent.co.uk, Colby Short, commented:
“Painful reading for many with the result of prolonged market uncertainty essentially wiping out 50% or more of their yearly earnings. Those in Haringey, Southwark and Camden, in particular, won’t be best pleased as they have seen the value of their property fall faster than they can earn money.
Thankfully, those already on the ladder will only feel this pinch on their pocket if they are looking to sell and with the long-term durability of the UK property market, they could see a reversal in fortunes by the time they do.
As always, it’s not a story of doom and gloom everywhere and some houses have actually been hard at work for their owners earning a healthy salary of their own over the last year.”
|
Annual house price increases above the average wage level and next best areas as a percentage of the average wage
|
||||||
|
Location
|
Average Annual Net Salary
|
Average House Price (April 2018)
|
Average House Price (April 2019)
|
House Price Growth (£)
|
Difference between Salary & AverageHP growth
|
House price growth to wage (%)
|
|
North Devon
|
£18,599
|
£221,095
|
£245,504
|
£24,410
|
£5,810
|
131%
|
|
Derbyshire Dales
|
£24,796
|
£252,263
|
£283,321
|
£31,058
|
£6,263
|
125%
|
|
Cotswold
|
£24,641
|
£355,520
|
£384,438
|
£28,917
|
£4,277
|
117%
|
|
Purbeck
|
£18,145
|
£310,688
|
£331,535
|
£20,847
|
£2,702
|
115%
|
|
Forest Heath
|
£23,077
|
£198,385
|
£219,249
|
£20,864
|
-£2,213
|
90%
|
|
Rochford
|
£25,209
|
£332,350
|
£353,447
|
£21,097
|
-£4,112
|
84%
|
|
Forest of Dean
|
£21,279
|
£225,054
|
£242,474
|
£17,420
|
-£3,860
|
82%
|
|
Blaenau Gwent
|
£18,224
|
£84,593
|
£98,956
|
£14,363
|
-£3,861
|
79%
|
|
Redditch
|
£19,419
|
£199,782
|
£214,930
|
£15,148
|
-£4,270
|
78%
|
|
Harborough
|
£26,432
|
£274,373
|
£294,721
|
£20,348
|
-£6,084
|
77%
|
|
United Kingdom
|
£23,821
|
£225,750
|
£228,903
|
£3,153
|
-£20,668
|
13%
|
|
|
|
|
|
|
|
|
|
Annual house price decline above average wage level
|
|
|
||||
|
Location
|
Average Annual Net Salary
|
Average House Price (April 2018)
|
Average House Price (April 2019)
|
House Price Growth (£)
|
Difference between Salary & AverageHP growth
|
House price growth to wage (%)
|
|
Haringey
|
£27,346
|
£555,449
|
£511,543
|
-£43,906
|
-£16,560
|
-161%
|
|
Southwark
|
£29,191
|
£517,934
|
£475,052
|
-£42,882
|
-£13,691
|
-147%
|
|
Camden
|
£43,224
|
£866,438
|
£814,375
|
-£52,063
|
-£8,839
|
-120%
|
|
|
|
|
|
|
|
|
|
Largest house price decline as a percentage of average wage outside of London
|
||||||
|
Location
|
Average Annual Net Salary
|
Average House Price (April 2018)
|
Average House Price (April 2019)
|
House Price Growth (£)
|
Difference between Salary & AverageHP growth
|
House price growth to wage (%)
|
|
Tandridge
|
£31,067
|
£448,006
|
£425,931
|
-£22,075.26
|
£8,992
|
-71%
|
|
Mole Valley
|
£30,638
|
£497,835
|
£476,361
|
-£21,474.00
|
£9,164
|
-70%
|
|
Chichester
|
£23,845
|
£381,762
|
£365,101
|
-£16,661.10
|
£7,184
|
-70%
|
|
West Oxfordshire
|
£23,174
|
£332,236
|
£316,470
|
-£15,765.79
|
£7,408
|
-68%
|
|
North Hertfordshire
|
£26,131
|
£352,785
|
£335,171
|
-£17,613.78
|
£8,517
|
-67%
|
|
North Dorset
|
£21,043
|
£262,533
|
£248,872
|
-£13,660.55
|
£7,383
|
-65%
|
|
Harrogate
|
£25,180
|
£287,109
|
£271,018
|
-£16,090.80
|
£9,090
|
-64%
|
|
New Forest
|
£21,842
|
£341,973
|
£328,254
|
-£13,718.90
|
£8,123
|
-63%
|
|
Rushmoor
|
£26,160
|
£289,963
|
£274,270
|
-£15,693.65
|
£10,466
|
-60%
|
|
Bracknell Forest
|
£25,840
|
£344,939
|
£329,844
|
-£15,094.66
|
£10,745
|
-58%
|
|
|
|
|
|
|
|
|
|
London boroughs – Annual house price change as a percentage of annual wage
|
||||||
|
Location
|
Average Annual Net Salary
|
Average House Price (April 2018)
|
Average House Price (April 2019)
|
House Price Growth (£)
|
Difference between Salary & AverageHP growth
|
House price growth to wage (%)
|
|
Haringey
|
£27,346
|
£555,449
|
£511,543
|
-£43,906
|
-£71,251
|
-161%
|
|
Southwark
|
£29,191
|
£517,934
|
£475,052
|
-£42,882
|
-£72,073
|
-147%
|
|
Camden
|
£43,224
|
£866,438
|
£814,375
|
-£52,063
|
-£95,287
|
-120%
|
|
Lambeth
|
£32,265
|
£516,207
|
£488,610
|
-£27,596
|
-£59,861
|
-86%
|
|
Barnet
|
£29,227
|
£541,502
|
£516,750
|
-£24,752
|
-£53,979
|
-85%
|
|
Kingston upon Thames
|
£31,723
|
£493,941
|
£467,894
|
-£26,047
|
-£57,770
|
-82%
|
|
City of London
|
£40,145
|
£732,351
|
£699,794
|
-£32,556
|
-£72,701
|
-81%
|
|
Ealing
|
£29,642
|
£481,101
|
£459,796
|
-£21,305
|
-£50,947
|
-72%
|
|
Harrow
|
£27,810
|
£465,391
|
£445,636
|
-£19,754
|
-£47,564
|
-71%
|
|
Islington
|
£39,473
|
£637,412
|
£613,718
|
-£23,694
|
-£63,167
|
-60%
|
|
Wandsworth
|
£41,726
|
£594,836
|
£569,833
|
-£25,004
|
-£66,729
|
-60%
|
|
Havering
|
£25,593
|
£369,070
|
£357,770
|
-£11,300
|
-£36,892
|
-44%
|
|
Brent
|
£24,711
|
£485,434
|
£474,540
|
-£10,893
|
-£35,604
|
-44%
|
|
Bromley
|
£32,749
|
£440,859
|
£430,242
|
-£10,616
|
-£43,365
|
-32%
|
|
Redbridge
|
£27,341
|
£412,072
|
£403,911
|
-£8,161
|
-£35,502
|
-30%
|
|
Tower Hamlets
|
£34,792
|
£455,910
|
£447,895
|
-£8,016
|
-£42,808
|
-23%
|
|
Sutton
|
£26,423
|
£375,827
|
£370,200
|
-£5,627
|
-£32,050
|
-21%
|
|
Bexley
|
£26,878
|
£338,476
|
£333,317
|
-£5,159
|
-£32,038
|
-19%
|
|
Enfield
|
£25,325
|
£396,942
|
£393,253
|
-£3,690
|
-£29,015
|
-15%
|
|
Lewisham
|
£27,638
|
£409,634
|
£406,614
|
-£3,020
|
-£30,658
|
-11%
|
|
Westminster
|
£53,821
|
£1,003,535
|
£998,912
|
-£4,623
|
-£58,444
|
-9%
|
|
Richmond upon Thames
|
£42,250
|
£649,078
|
£650,897
|
£1,820
|
-£40,430
|
4%
|
|
Croydon
|
£27,178
|
£368,281
|
£369,986
|
£1,705
|
-£25,473
|
6%
|
|
Hillingdon
|
£24,049
|
£408,618
|
£410,386
|
£1,768
|
-£22,281
|
7%
|
|
Waltham Forest
|
£25,408
|
£430,972
|
£433,158
|
£2,186
|
-£23,222
|
9%
|
|
Newham
|
£22,713
|
£360,618
|
£364,292
|
£3,674
|
-£19,039
|
16%
|
|
Hammersmith and Fulham
|
£39,314
|
£710,090
|
£718,767
|
£8,677
|
-£30,636
|
22%
|
|
Merton
|
£34,377
|
£494,428
|
£502,107
|
£7,680
|
-£26,698
|
22%
|
|
Barking and Dagenham
|
£22,007
|
£291,184
|
£299,029
|
£7,845
|
-£14,162
|
36%
|
|
Hounslow
|
£25,757
|
£387,621
|
£398,170
|
£10,549
|
-£15,208
|
41%
|
|
Greenwich
|
£32,009
|
£383,039
|
£396,529
|
£13,490
|
-£18,519
|
42%
|
|
Hackney
|
£26,702
|
£529,850
|
£541,802
|
£11,952
|
-£14,750
|
45%
|
|
Kensington and Chelsea
|
no data
|
£1,325,081
|
£1,288,685
|
-£36,396
|
n/a
|
n/a
|
|
|
|
|
|
|
|
|
|
London
|
£31,114
|
£477,253
|
£471,504
|
-£5,749
|
|
-18%
|
You May Also Enjoy
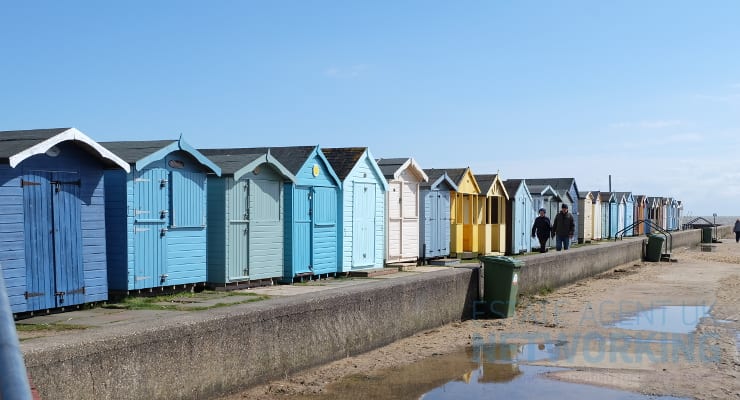
Beach hut values fall for second consecutive year
Burnham’s property and land tax: what would it mean for property owners?
Homebuyers can save up to 47% by looking next door to the UK’s priciest postcodes

Your First-Time Buyer Mortgage Journey
London property values set to fall