How to avoid the Brexit market blues – new builds outpace existing stock prices over the last decade
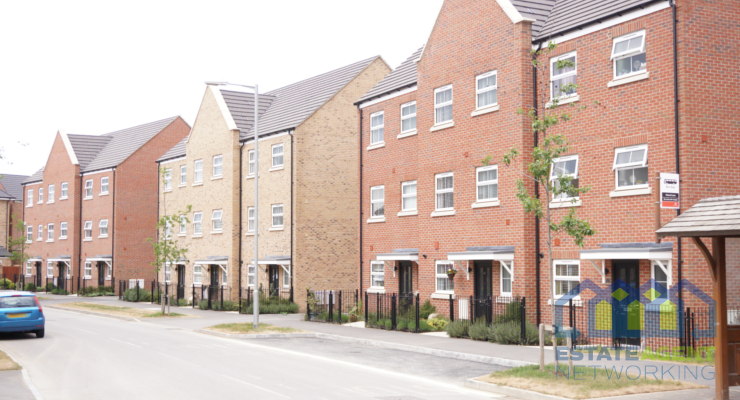
New build house prices are rising by a greater percentage than existing stock – demonstrating how these homes can end up being the better buy in the long run despite talk of a ‘new build premium’.
Research from new build specialist Stone Real Estate found that between 2014 and 2019 UK new build prices have risen by 27% compared to 22% for existing stock, a difference of 5%.
There’s a big difference between the two in Wales, where new builds have risen by 26.5% compared to 18.3% with existing stock. There’s also a difference of 6.9% in Scotland; 5.9% in England; and 5.7% in Northern Ireland.
The difference is more pronounced in some regions, with new build prices rising by 26.1% in the City of London compared to 13.6% for existing property, a variance of 12.5%.
Similarly, new build prices have inflated by 10.6% more than existing stock in Redbridge, London; 9.3% more in Oldham, Greater Manchester; and 9.1% more in Merthyr Tydfil in Wales.
The past 10 years
If you compare new build prices with existing stock in the past decade, it’s a similar story.
Between 2009 and 2019 UK new build prices rose by 46.9%, compared to 41.5% with existing stock, a difference of 5.4%.
Over the past decade the biggest difference is in Scotland, where new build price growth is 25.4% and for existing stock it’s 14.6%, a difference of 10.7%.
Once again there’s a big difference in Wales, where new build prices have increased by 8.1% more. Meanwhile new builds have risen by 6.7% more in England.
Focusing on smaller regions, the biggest gap remains in the City of London, where new build prices have inflated by 124.8% in the past 10 years compared to 108.2% for existing stock – a 16.6% difference.
New build growth was 16.5% higher in Three Rivers, Hertfordshire; 15% higher in Folkestone & Hythe, Kent; and 14.2% higher in East Lothian, Scotland.
Since the EU Referendum
Since the EU Referendum vote of July 2016 new build prices have grown by almost 4% more across the UK, with a rise of 9.9% compared to 6% for existing stock. In London, the price of new builds has increased by 1.6% since the vote, while existing property prices have actually dropped, down -2.1%.
By area, Blackburn with Darwen saw the biggest percentage increase in new build prices compared to existing properties, after seeing new build prices rise by 17.8%, 6.4% more than the 11.4% recorded for other homes.
Behind that is Oldham in Greater Manchester, with a gap of 5.3%; then Barrow-In-Furness, Cumbria with a difference of 5.2%.
Unusually, in Northern Ireland new build prices only increased by 6.94% compared to 9.45% for existing stock between July 2016 and 2019 – so very occasionally, new build doesn’t always perform better.
Founder and CEO of Stone Real Estate, Michael Stone, commented:
“While new build homes often come under fire due to the price premium involved, it’s abundantly clear that they have proven to be the best bricks and mortar investment option over the past 10 years when it comes to holding value.
Despite the bumpy ride of Brexit uncertainty over the last few years, new build property values have increased in every region of the UK, while existing stock has failed to keep pace, or in some cases, even seen a decline.
This is largely due to build quality and condition and with new builds you can be sure the property is modern, structurally sound and energy-efficient – all features a buyer will look for.”
|
Over the last decade – 2009 to 2019
|
|||
|
Location
|
Average New Build Price Growth (2009-2019)
|
Existing Price Growth ( 2009-2019)
|
Difference – NB and Existing % growth
|
|
City of London
|
124.77%
|
108.17%
|
16.60%
|
|
Three Rivers
|
95.12%
|
78.58%
|
16.54%
|
|
Folkestone and Hythe
|
67.69%
|
52.72%
|
14.97%
|
|
East Lothian
|
45.29%
|
31.11%
|
14.19%
|
|
Fife
|
29.78%
|
16.60%
|
13.18%
|
|
West Lothian
|
39.53%
|
26.54%
|
12.99%
|
|
Richmond upon Thames
|
89.17%
|
76.19%
|
12.98%
|
|
Bracknell Forest
|
77.14%
|
64.61%
|
12.54%
|
|
King’s Lynn and West Norfolk
|
57.29%
|
44.78%
|
12.51%
|
|
Ashford
|
67.70%
|
55.20%
|
12.50%
|
|
UNITED KINGDOM
|
46.87%
|
41.48%
|
5.39%
|
|
ENGLAND
|
53.25%
|
46.60%
|
6.65%
|
|
WALES
|
33.38%
|
25.25%
|
8.13%
|
|
SCOTLAND
|
25.38%
|
14.63%
|
10.75%
|
|
NORTHERN IRELAND
|
-2.00%
|
-5.04%
|
-3.03%
|
|
NORTH EAST
|
12.52%
|
3.99%
|
8.53%
|
|
NORTH WEST
|
31.37%
|
24.30%
|
7.07%
|
|
YORKSHIRE AND THE HUMBER
|
31.36%
|
23.65%
|
7.72%
|
|
EAST MIDLANDS
|
52.96%
|
41.97%
|
10.99%
|
|
WEST MIDLANDS
|
42.73%
|
38.03%
|
4.71%
|
|
EAST OF ENGLAND
|
71.93%
|
62.55%
|
9.38%
|
|
LONDON
|
86.81%
|
80.80%
|
6.00%
|
|
SOUTH EAST
|
65.99%
|
58.45%
|
7.54%
|
|
SOUTH WEST
|
47.16%
|
41.79%
|
5.37%
|
|
Over the last five years – 2014 to 2019
|
|||
|
Location
|
Average New Build Price Growth (2014-2019)
|
Existing Price Growth ( 2014-2019)
|
Difference – NB and Existing % growth
|
|
City of London
|
26.11%
|
13.60%
|
12.51%
|
|
Redbridge
|
45.00%
|
34.39%
|
10.61%
|
|
Oldham
|
27.92%
|
18.61%
|
9.31%
|
|
Merthyr Tydfil
|
27.36%
|
18.24%
|
9.12%
|
|
Maldon
|
49.24%
|
40.26%
|
8.97%
|
|
Thurrock
|
54.70%
|
46.09%
|
8.61%
|
|
Barrow-in-Furness
|
30.00%
|
21.40%
|
8.60%
|
|
Blackburn with Darwen
|
27.45%
|
18.87%
|
8.58%
|
|
City of Glasgow
|
31.00%
|
22.60%
|
8.50%
|
|
Maidstone
|
36.83%
|
28.51%
|
8.33%
|
|
UNITED KINGDOM
|
27.00%
|
21.99%
|
5.01%
|
|
WALES
|
26.47%
|
18.30%
|
8.17%
|
|
SCOTLAND
|
20.00%
|
13.13%
|
6.87%
|
|
ENGLAND
|
29.18%
|
23.33%
|
5.85%
|
|
NORTHERN IRELAND
|
30.84%
|
25.09%
|
5.75%
|
|
EAST OF ENGLAND
|
39.20%
|
31.91%
|
7.29%
|
|
NORTH WEST
|
27.03%
|
19.79%
|
7.24%
|
|
EAST MIDLANDS
|
33.17%
|
26.05%
|
7.12%
|
|
NORTH EAST
|
13.09%
|
6.21%
|
6.88%
|
|
YORKSHIRE AND THE HUMBER
|
24.39%
|
17.53%
|
6.86%
|
|
SOUTH EAST
|
31.84%
|
25.52%
|
6.33%
|
|
SOUTH WEST
|
28.44%
|
22.50%
|
5.94%
|
|
WEST MIDLANDS
|
30.74%
|
24.85%
|
5.89%
|
|
LONDON
|
25.30%
|
20.57%
|
4.74%
|
|
Since the EU Ref – July 2016 to 2019
|
|||
|
Location
|
Average New Build Price Growth (July 2016-2019)
|
Existing Price Growth (July 2016-2019)
|
Difference – NB and Existing % growth
|
|
Blackburn with Darwen
|
17.77%
|
11.38%
|
6.38%
|
|
Oldham
|
14.88%
|
9.62%
|
5.26%
|
|
Barrow-in-Furness
|
11.25%
|
6.02%
|
5.23%
|
|
Redbridge
|
8.77%
|
3.74%
|
5.03%
|
|
Merthyr Tydfil
|
9.61%
|
4.83%
|
4.78%
|
|
West Dunbartonshire
|
10.91%
|
6.23%
|
4.69%
|
|
Na h-Eileanan Siar
|
13.81%
|
9.28%
|
4.53%
|
|
Burnley
|
14.32%
|
9.90%
|
4.41%
|
|
Worcestershire
|
15.29%
|
10.89%
|
4.39%
|
|
Barnsley
|
13.87%
|
9.69%
|
4.18%
|
|
UNITED KINGDOM
|
9.91%
|
5.95%
|
3.96%
|
|
WALES
|
14.27%
|
9.21%
|
5.06%
|
|
SCOTLAND
|
9.58%
|
4.73%
|
4.85%
|
|
ENGLAND
|
9.59%
|
5.76%
|
3.83%
|
|
NORTHERN IRELAND
|
6.94%
|
9.45%
|
-2.51%
|
|
NORTH WEST
|
12.71%
|
7.59%
|
5.12%
|
|
YORKSHIRE AND THE HUMBER
|
10.94%
|
6.04%
|
4.89%
|
|
EAST MIDLANDS
|
15.90%
|
11.07%
|
4.83%
|
|
SOUTH WEST
|
12.13%
|
7.47%
|
4.65%
|
|
WEST MIDLANDS
|
15.41%
|
10.84%
|
4.57%
|
|
EAST OF ENGLAND
|
10.72%
|
6.62%
|
4.11%
|
|
SOUTH EAST
|
6.84%
|
3.37%
|
3.47%
|
|
NORTH EAST
|
3.64%
|
-1.24%
|
2.39%
|
|
LONDON
|
1.59%
|
-2.06%
|
3.65%
|
You May Also Enjoy

ONS Private Rent and House Prices Index- May 2026

Cyprus in demand as international property inquiries spike

Inflation falls to 2.8%

London gardens can add more than £205,000 in value

RRA raises the cost of getting property management wrong