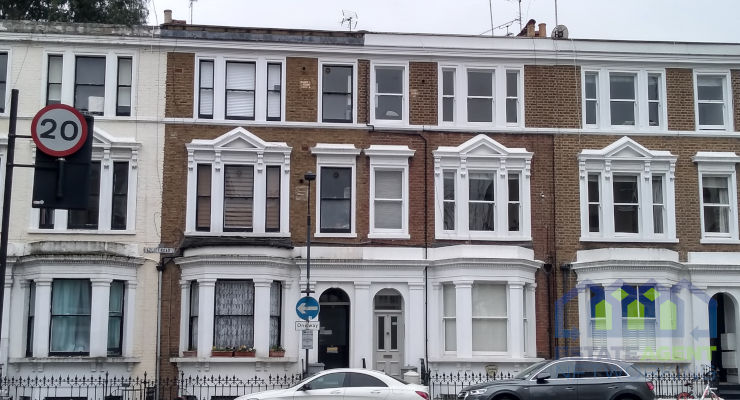
Living in an ASBO hotspot could cost you £60k on the price of your home
Research by national estate agent, Springbok Properties, has looked at the property cost of living in one of the nation’s most anti-social areas based on the average house price in locations with the largest number of ASBOs issued compared to the wider area.
Springbok Properties looked at the average yearly number of ASBOs issued across criminal justice areas in England and Wales and compared the house prices for these areas to the wider region to see how they performed.
Across the nation’s top ten ASBO hotspots, the average house price is £213,880 compared to £228,109 in the wider regions, a -6.2% drop and cash difference of £14,230.
In contrast, the top ten areas with the lowest number of ASBOs were home to an average house price of £275,407, some 12.7% higher than the wider region, equating to an additional £31,043 in property values.
The worst
The worst place for homeowners in terms of price depreciation in the top 10 ASBO hotspots was Hampshire and the Isle of Wight, where the average house price was a huge -19.7% lower than the wider region – a drop of £65,002!
Lancashire also ranked high in terms of house price decline, -12.1% or £20,228 lower than the wider region.
Other ASBO areas with some of the largest differences in house price are Avon and Somerset, Merseyside and the West Midlands.
The best
For the best neighbours and the most robust house price growth, head to Surrey. The area sees some of the lowest numbers of ASBOs issued on a yearly basis and the average house price is 36.4% (£119,773) higher than the wider region.
Warwickshire and North Yorkshire are also some of the best areas to live for a happy house price return.
Founder and CEO of Springbok Properties, Shepherd Ncube, commented:
“No matter where you buy in the UK there will always be some degree of anti-social behaviour but the figures show that homes in areas with a higher level tend to sell for less when compared to both the wider area and the locations with a lower level.
Any degree of crime can be a big deterrent for potential buyers and so when looking to buy it’s important to do your research and consider things like anti-social behaviour in relation to your budget in order to find the best balance for your personal situation.
Not every area will be as bad as the top line figures make out so when viewing it’s always advised to ask the neighbours, or even local business owners, to get a realistic picture.”
|
Top 10 areas with the highest average yearly number of ASBOs, sorted by house price difference between the area and wider region
|
||||||
|
Criminal Justice Area
|
Average annual ASBOs issued in the last decade
|
Average house price
|
Region
|
Average house price
|
Difference (£)
|
Difference (%)
|
|
Hampshire & Isle of Wight
|
53.7
|
£264,195
|
South East
|
£329,197
|
-£65,002
|
-19.7%
|
|
Lancashire
|
70.6
|
£147,455
|
North West
|
£167,683
|
-£20,228
|
-12.1%
|
|
Avon and Somerset
|
47.7
|
£236,370
|
South West
|
£260,158
|
-£23,788
|
-9.1%
|
|
Merseyside
|
90.5
|
£152,662
|
North West
|
£167,683
|
-£15,021
|
-9.0%
|
|
West Midlands
|
148.6
|
£171,687
|
West Midlands
|
£188,378
|
-£16,691
|
-8.9%
|
|
Nottinghamshire
|
55.4
|
£179,760
|
East Midlands
|
£194,219
|
-£14,458
|
-7.4%
|
|
West Yorkshire
|
150.8
|
£161,816
|
Yorkshire and the Humber
|
£165,745
|
-£3,929
|
-2.4%
|
|
Greater London
|
262.5
|
£469,242
|
London
|
£474,601
|
-£5,359
|
-1.1%
|
|
Greater Manchester
|
146.8
|
£175,343
|
North West
|
£167,683
|
£7,660
|
4.6%
|
|
Humberside
|
72.6
|
£180,266
|
Yorkshire and the Humber
|
£165,745
|
£14,521
|
8.8%
|
|
Average
|
109.9
|
£213,880
|
Average
|
£228,109
|
-£14,230
|
-6.2%
|
|
Top 10 areas with the lowest average yearly number of ASBOs, sorted by house price difference between the area and wider region
|
||||||
|
Criminal Justice Area
|
Average annual ASBOs issued in the last decade
|
Average house price
|
Region
|
Average house price
|
Difference (£)
|
Difference (%)
|
|
Surrey
|
16.7
|
£448,970
|
South East
|
£329,197
|
£119,773
|
36.4%
|
|
Warwickshire
|
10.5
|
£256,302
|
West Midlands
|
£188,378
|
£67,924
|
36.1%
|
|
North Yorkshire
|
15.7
|
£222,442
|
Yorkshire and the Humber
|
£165,745
|
£56,697
|
34.2%
|
|
Dyfed Powys
|
4.7
|
£192,127
|
Wales
|
£164,433
|
£27,694
|
16.8%
|
|
Dorset
|
16.1
|
£297,003
|
South West
|
£260,158
|
£36,845
|
14.2%
|
|
Wiltshire
|
8.7
|
£275,921
|
South West
|
£260,158
|
£15,763
|
6.1%
|
|
Bedfordshire
|
15.9
|
£304,832
|
East
|
£291,993
|
£12,839
|
4.4%
|
|
Gloucestershire
|
11.0
|
£271,009
|
South West
|
£260,158
|
£10,851
|
4.2%
|
|
Lincolnshire
|
10.2
|
£184,845
|
East Midlands
|
£194,219
|
-£9,373
|
-4.8%
|
|
Kent
|
16.3
|
£300,617
|
South East
|
£329,197
|
-£28,580
|
-8.7%
|
|
Average
|
12.6
|
£275,407
|
Average
|
£244,364
|
£31,043
|
12.7%
|


