

Prime London Stamp Duty Bills Enough to Buy a House in 167 areas of the UK
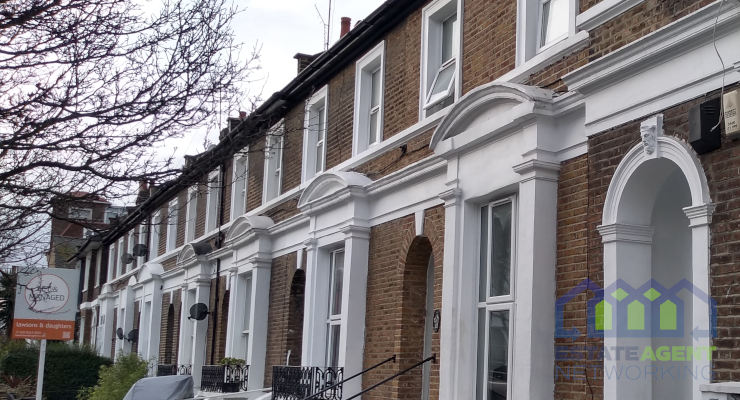
It’s cheaper to buy a detached house in much of the UK than pay stamp duty land tax in prime central London demonstrating the vast difference between different segments of the market.
Since changes to stamp duty tax from the traditional slab scale method, the Government has looked to make the cost more favourable for homebuyers, although those at the top end of the market have been left considerably worse off.
Analysis from the national fast sale agent, Springbok Properties, shows that if you bought a detached house in Kensington and Chelsea, you would be facing a stamp duty bill of £318,800 on the typical house price of £3.38m.
Using data from the Land Registry, Springbok then looked at where across the UK this additional eye-water bill could secure you a whole detached home and as you can imagine, there are quite a few locations.
Three homes for the price of stamp duty
For the same amount as that stamp duty bill, you could almost buy three detached homes in Northern Ireland, where they typically cost £108,400 each.
Properties are also far cheaper in Scotland (£266,300) and Wales (£248,300), although on a national level they are higher in England (£375,600).
However, looking at the UK house price rankings, there are some 167 areas where prime central London stamp duty sums exceed the average house price, with the cost sitting between the Isle of Wight (£319,510) and Hambleton (£316,909).
While this sum is enough to get on the ladder in the likes of Hambleton, Newport, Kettering, Forest of Dean, Manchester, Plymouth and more, at the other end of the table you could even double up on your bricks and mortar.
In the Scottish Western Isles, Burnley and Blaenau Gwent in Wales, you could afford two homes at the average house price, with the likes of County Durham, East Ayrshire, Hyndburn, Blackpool and Stoke not far behind that.
Founder and CEO of Springbok Properties, Shepherd Ncube, commented:
“Stamp duty continues to be an additional financial burden that many fail to properly account for when buying a house and it can catch many potential buyers out as a result.
The one silver lining for the average UK homebuyer is that they aren’t paying the astronomical sums required to purchase at the very top end of London’s property ladder.
It’s quite astonishing that such sums are paid to cover stamp duty when many struggle to get on the ladder at all and this is just for a typical property sale, not a second home which would incur an additional three percent charge.
The Government has certainly achieved in its objective to dampen the appetite of foreign buyers in London’s prime market by adjusting the stamp duty thresholds, but this seems to have had an impact across the board and you can see why.”
|
Stamp Duty House Prices
|
|
|
Location
|
Stamp duty (SDLT)
|
|
Kensington & Chelsea
|
£318,775
|
|
Average detached comparrative house price
|
|
|
Location
|
AverageDetached Price (latest July 2019)
|
|
United Kingdom
|
£351,678
|
|
England
|
£375,593
|
|
Wales
|
£248,324
|
|
Scotland
|
£266,304
|
|
Northern Ireland
|
£108,398
|
|
By Area
|
|
|
Isle of Wight
|
£319,510
|
|
Kensington & Chelsea Stamp Duty
|
£318,775
|
|
Hambleton
|
£316,909
|
|
Newport
|
£316,579
|
|
Kettering
|
£315,301
|
|
Forest of Dean
|
£314,259
|
|
Manchester
|
£314,114
|
|
City of Plymouth
|
£313,640
|
|
Ryedale
|
£313,211
|
|
Shropshire
|
£312,912
|
|
South Staffordshire
|
£312,689
|
|
Leicester
|
£309,777
|
|
City of Peterborough
|
£308,416
|
|
Salford
|
£307,138
|
|
South Kesteven
|
£306,019
|
|
Hinckley and Bosworth
|
£305,511
|
|
North Warwickshire
|
£305,462
|
|
Wyre Forest
|
£302,274
|
|
Bury
|
£301,612
|
|
Newcastle upon Tyne
|
£299,911
|
|
Eden
|
£299,215
|
|
Tendring
|
£297,360
|
|
Breckland
|
£296,881
|
|
North Tyneside
|
£296,321
|
|
Richmondshire
|
£295,436
|
|
Corby
|
£293,874
|
|
Stafford
|
£293,368
|
|
King’s Lynn and West Norfolk
|
£293,298
|
|
Tamworth
|
£291,410
|
|
Sefton
|
£291,129
|
|
Sheffield
|
£290,278
|
|
Waveney
|
£289,786
|
|
Fylde
|
£285,425
|
|
West Lancashire
|
£284,692
|
|
West Lothian
|
£282,401
|
|
Staffordshire
|
£282,210
|
|
Nuneaton and Bedworth
|
£281,728
|
|
Perth and Kinross
|
£280,785
|
|
Selby
|
£280,740
|
|
North West Leicestershire
|
£278,991
|
|
Calderdale
|
£278,871
|
|
Newark and Sherwood
|
£277,090
|
|
East Staffordshire
|
£274,794
|
|
Dudley
|
£274,442
|
|
West Yorkshire
|
£271,972
|
|
Walsall
|
£270,055
|
|
Gedling
|
£269,183
|
|
Wirral
|
£269,028
|
|
Chorley
|
£266,253
|
|
Lancaster
|
£265,485
|
|
Broxtowe
|
£264,632
|
|
Aberdeenshire
|
£264,446
|
|
East Riding of Yorkshire
|
£263,499
|
|
Nottinghamshire
|
£261,966
|
|
Derbyshire
|
£261,715
|
|
City of Dundee
|
£261,699
|
|
Tameside
|
£261,180
|
|
South Derbyshire
|
£261,045
|
|
Tyne and Wear
|
£259,980
|
|
North East Derbyshire
|
£259,021
|
|
Cumbria
|
£257,715
|
|
Great Yarmouth
|
£256,240
|
|
Torfaen
|
£254,569
|
|
Liverpool
|
£254,459
|
|
Scarborough
|
£254,377
|
|
Merseyside
|
£254,168
|
|
Fenland
|
£254,150
|
|
North Kesteven
|
£252,693
|
|
Sandwell
|
£252,124
|
|
Telford and Wrekin
|
£251,565
|
|
Cannock Chase
|
£250,998
|
|
Bradford
|
£250,692
|
|
Chesterfield
|
£250,388
|
|
Northumberland
|
£250,272
|
|
Amber Valley
|
£250,160
|
|
City of Derby
|
£250,036
|
|
South Ribble
|
£248,986
|
|
Highland
|
£248,671
|
|
Wales
|
£248,324
|
|
Lancashire
|
£248,094
|
|
Wolverhampton
|
£246,973
|
|
Powys
|
£246,747
|
|
Kirklees
|
£246,689
|
|
Erewash
|
£246,680
|
|
Lincoln
|
£246,466
|
|
Halton
|
£246,236
|
|
Staffordshire Moorlands
|
£245,982
|
|
Angus
|
£244,987
|
|
Lincolnshire
|
£244,918
|
|
Scottish Borders
|
£244,912
|
|
South Tyneside
|
£243,783
|
|
Rochdale
|
£243,111
|
|
Inverclyde
|
£242,052
|
|
Bolton
|
£241,862
|
|
Renfrewshire
|
£241,685
|
|
Pembrokeshire
|
£241,659
|
|
Gateshead
|
£241,180
|
|
South Lanarkshire
|
£239,946
|
|
City of Nottingham
|
£239,663
|
|
Isle of Anglesey
|
£239,264
|
|
Ceredigion
|
£238,879
|
|
Fife
|
£238,202
|
|
Flintshire
|
£238,168
|
|
Swansea
|
£237,979
|
|
Oldham
|
£237,483
|
|
South Holland
|
£237,473
|
|
Bridgend
|
£237,033
|
|
Newcastle-under-Lyme
|
£237,029
|
|
Wakefield
|
£235,677
|
|
Wrexham
|
£233,880
|
|
Conwy
|
£233,113
|
|
Rossendale
|
£231,004
|
|
Caerphilly
|
£230,582
|
|
Falkirk
|
£229,547
|
|
Clackmannanshire
|
£228,661
|
|
Bassetlaw
|
£228,171
|
|
Preston
|
£226,764
|
|
Allerdale
|
£226,751
|
|
Wigan
|
£226,679
|
|
Gwynedd
|
£225,519
|
|
Moray
|
£225,496
|
|
Shetland Islands
|
£225,377
|
|
South Ayrshire
|
£224,722
|
|
South Yorkshire
|
£222,465
|
|
Boston
|
£222,089
|
|
Darlington
|
£221,693
|
|
East Lindsey
|
£221,249
|
|
Stockton-on-Tees
|
£219,390
|
|
West Dunbartonshire
|
£218,579
|
|
West Lindsey
|
£218,002
|
|
Argyll and Bute
|
£217,732
|
|
Wyre
|
£216,720
|
|
Carlisle
|
£216,194
|
|
Sunderland
|
£216,002
|
|
Barrow-in-Furness
|
£214,253
|
|
Rotherham
|
£212,808
|
|
City of Kingston upon Hull
|
£212,560
|
|
Knowsley
|
£211,770
|
|
North Lanarkshire
|
£210,894
|
|
St Helens
|
£209,958
|
|
Blackburn with Darwen
|
£208,380
|
|
Ashfield
|
£204,387
|
|
North East Lincolnshire
|
£201,665
|
|
North Lincolnshire
|
£200,036
|
|
Orkney Islands
|
£199,002
|
|
Mansfield
|
£198,503
|
|
Doncaster
|
£195,967
|
|
Barnsley
|
£195,961
|
|
Denbighshire
|
£195,849
|
|
Carmarthenshire
|
£194,775
|
|
Copeland
|
£194,678
|
|
Rhondda Cynon Taf
|
£193,427
|
|
Merthyr Tydfil
|
£193,420
|
|
Redcar and Cleveland
|
£191,490
|
|
Dumfries and Galloway
|
£190,541
|
|
North Ayrshire
|
£190,116
|
|
Pendle
|
£187,773
|
|
Middlesbrough
|
£187,691
|
|
Hartlepool
|
£187,038
|
|
Neath Port Talbot
|
£180,784
|
|
Bolsover
|
£180,035
|
|
Stoke-on-Trent
|
£179,123
|
|
Blackpool
|
£174,923
|
|
Hyndburn
|
£169,971
|
|
East Ayrshire
|
£168,926
|
|
County Durham
|
£165,916
|
|
Blaenau Gwent
|
£159,245
|
|
Burnley
|
£157,260
|
|
The Western Isles
|
£145,081
|

You May Also Enjoy
First-time buyer enquiries fall 27% as borrowing costs rise

Homes completing on Friday the 13th sell for less
Surrey, Herts & Bucks named most exclusive markets
Friday the 13th spooks home-movers
Section 21 reform divides landlords and tenants