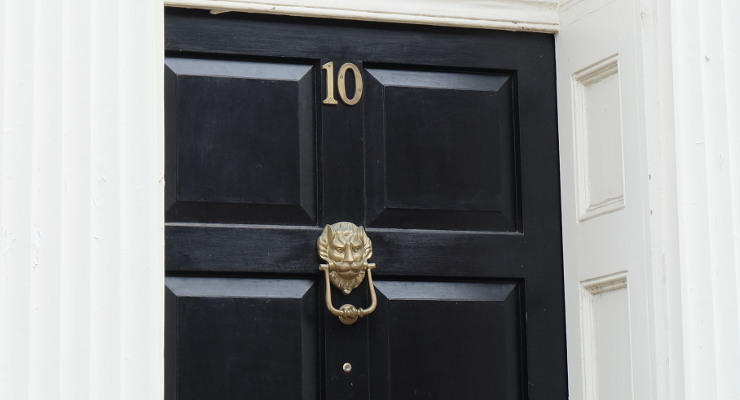
The numbers game – which is the nation’s most valuable house number

The latest research by national fast sale estate agent, Springbok Properties, has analysed property sale records over the last year by the listed address number to ascertain which is the most valuable for both houses and flats.

Most Expensive House Numbers

The research shows that when it comes to a house, single digits are so last year and in fact, just one single digit number makes the top 50 most expensive house numbers.

With an average sold price of £298,879, the No.1 is the most expensive single digit house number ranking 43rd.

The most valuable? No.713 with an average house price of £612,847, closely followed by 711 and 709, both with an average sold price above £500,000.

855, 529, 715, 417, 665, 694 and 607 also commanded some of the highest house price tags.

Most Expensive Flat Numbers

When it comes to flats, it’s a similar story with just two single digit numbers ranking in the top 50. Again, the No.1 places as the highest single property number ranking 6th with an average sold price of £520,808, while the No.6 ranks 27th with an average sold price of £385,060.

With an average sold price of £808,446, the most valuable flat number is 500.

237, 190, 251, 194, 510, 37, 195 and 220 were amongst the other most valuable flat numbers when it comes to the price paid.

Founder and CEO of Springbok Properties, Shepherd Ncube, commented: 

“A properties value is determined on a whole host of factors, but you would be surprised about the influence a number can have on how much a buyer is willing to pay.

For most, it simply doesn’t matter, but some buyers will pay over the odds for a particular number for sentimental reasons or avoid a property altogether due to superstition.

Previously the prestige of owning the number one property on a street was highly valued amongst buyers, but as the way we live and the type of properties we live in has evolved, this is clearly no longer the case.

In this day and age a shortage of space and our tendency to build up, not out, means those higher numbers closer to the top of a development are now more desirable.”

House Numbers
Average Sold Price
 
Flat Numbers
Average Sold Price
713
£612,847
500
£808,446
711
£580,643
237
£713,181
709
£508,833
190
£683,463
855
£411,200
251
£658,830
529
£407,850
194
£524,131
715
£405,000
1
£520,808
417
£392,738
510
£512,615
665
£385,750
37
£512,592
694
£381,000
195
£473,700
607
£366,411
220
£462,288


Properganda PR

National and local media coverage for property businesses. Journo quotes delivered in minutes.

You May Also Enjoy

Damaged timber from Dry Rot
Estate Agent Talk

Mould and damp – what you need to know ahead of winter

With the winter months just round the corner, problems with damp and mould can become far more prominent. Autumntime is when many people turn on central heating systems and choose to close windows, preventing fresh air ventilation needed to allow damp air to leave a property. Unfortunately, the combination of warm and damp air can…
Read More
Breaking News

Rental price and average salary tracker – September 2025

London and South East see biggest dips in required rental salary year-on-year London and the South East saw the sharpest dips year-on-year in the average salary needed in order to rent the average home in that area. London saw a 4.2% drop, whilst the South East saw a decline of 2.9%. Yorkshire and Humberside saw…
Read More
buying at auction uk
Breaking News

The cities where buying beats renting – with just a 5% deposit

British first-time buyer mortgage payments are typically 17% cheaper than renting, even with a low 5% deposit The average 5% deposit is £11,412 based on a typical first-time buyer property price of £228,233 Among major cities outside London, the biggest gap between owning and renting is in Glasgow, where buyers could save more than £4,750…
Read More
Rightmove logo
Breaking News

Rightmove’s Weekly Mortgage Rates Tracker

Average rates for 2-year and 5-year fixed-rate mortgages   Term Average rate Weekly change Yearly change 2-year fixed 4.51% +0.00% -0.37% 5-year fixed 4.55% +0.01% +0.01%   Lowest rates for 2-year and 5-year fixed-rate mortgages   Term Lowest rate Weekly change Yearly change 2-year fixed 3.77% +0.05% -0.07% 5-year fixed 3.97% +0.10% +0.29%   Average…
Read More
Rightmove logo
Breaking News

Data and commentary from Rightmove on stamp duty reforms

Colleen Babcock, Rightmove’s property expert said: “We’ve been calling for stamp duty reform for some time now, as it’s a significant barrier for many people moving home. Abolishing it completely would remove one of the biggest barriers to moving, unlocking more moves at all stages of the property ladder. “Our data shows that only 5%…
Read More
Breaking News

Second-time buyers dominate demand for longer term fixed mortgage deals

Second-time buyers are dominating demand for longer term fixed mortgage deals, fresh data from Moneyfacts Analyser can reveal. Of those looking for fixed term deals on moneyfactscompare.co.uk: Almost two-thirds (58%) of second-time buyers who compared mortgage deals using the moneyfactscompare.co.uk website were considering terms of three years or longer in the 30 days to 1…
Read More