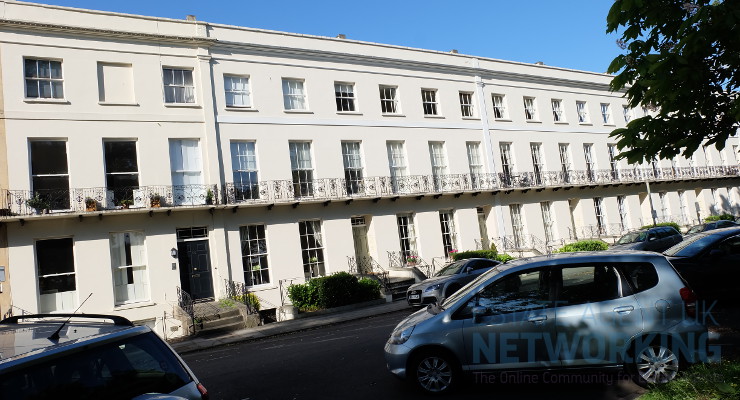
The UK property pockets where house prices are up 400%+ in two decades, 100% in the last decade alone
The latest research by lettings and sale agent, Benham and Reeves, has revealed that London has seen the largest increase in house prices of all UK regions in the last decade, up 83% and a huge 308% since the turn of the Millennium.
The latest and last Land Registry house price index including data for 2019 has just been released shining a light on house price performance over the full year, the decade and last twenty years.
Benham and Reeves crunched the numbers to look at the average yearly house price and how this has changed over the last decade and the last two decades.
The numbers show that across the UK property prices are up some 43% in the last ten years, although growth this Millennium has already hit 197% despite a huge market correction during the financial crash in 2007.
London in the last decade
Over the last decade, Waltham Forest is the borough to have helped drive this price growth within the capital to the largest extent, with prices increasing by 111%. The City of London has also seen one of the largest increases in the last decade up 104%, along with Haringey (99%), Hackney (97%) and Lewisham (94%).
Believe it or not, Hammersmith and Fulham has seen the lowest rate of house price growth in the last ten years, with prices up just 65%. Tower Hamlets and Hounslow have also seen some of the lowest increases.
London since the turn of the Millennium
Hackney tops the table for price growth since the turn of the Millennium with an increase of 427%, with Waltham Forest again ranking high (415%) along with Newham (388%) and Lewisham (385%).
The UK in the 10 and 20 years
Over the last 10 years, Cambridge (79%) Hertsmere (79%), Three Rivers (77%), Bristol (77%) and Slough (76%) have topped the table for house price growth outside of London.
Manchester (355%), Thanet (347%), Thurrock (342%), Brighton and Hove (335%) and Southend (334%) have seen the largest increases in the last 20 years.
Marc von Grundherr, director of lettings and sale agent, Benham and Reeves, commented:
“For many of us, ringing in a new Millennium may seem like it was yesterday, but since then the UK property market has continued to go from strength to strength, registering some huge increases in value not just in London, but across the UK.
This comes despite a market crash that all but re-levelled the playing field and the substantial growth that has followed in the last decade alone is proof of the market’s resilience and tenacity.
This is accentuated within the boundaries of the capital where even the worst-performing boroughs have seen property values skyrocket.
When you consider this growth against the more recent Brexit blighted backdrop that many predicted would topple the market we are far from in trouble and, with a newly rejuvenated level of confidence since December’s election, the following decade should bring more of the same where property price growth is concerned.”
|
Primary level – nations
|
|||||
|
Location
|
2019 AveHP
|
2009 AveHP
|
1999 AveHP
|
10 year change
|
20 year change
|
|
England
|
£247,400
|
£166,559
|
£70,071
|
49%
|
253%
|
|
Wales
|
£163,689
|
£127,658
|
£50,126
|
28%
|
227%
|
|
Scotland
|
£151,788
|
£129,881
|
£49,924
|
17%
|
204%
|
|
Northern Ireland
|
£138,129
|
£141,384
|
£62,048
|
-2%
|
123%
|
|
United Kingdom
|
£231,215
|
£161,148
|
£77,961
|
43%
|
197%
|
|
|
|
|
|
|
|
|
Secondary level – regions
|
|||||
|
Location
|
2019 AveHP
|
2009 AveHP
|
1999 AveHP
|
10 year change
|
20 year change
|
|
London
|
£472,524
|
£257,854
|
£115,686
|
83%
|
308%
|
|
East of England
|
£290,928
|
£177,386
|
£76,768
|
64%
|
279%
|
|
East Midlands
|
£193,520
|
£134,119
|
£55,834
|
44%
|
247%
|
|
South West
|
£256,607
|
£178,826
|
£74,707
|
43%
|
243%
|
|
South East
|
£322,210
|
£201,640
|
£94,201
|
60%
|
242%
|
|
Yorkshire and The Humber
|
£163,844
|
£129,734
|
£49,490
|
26%
|
231%
|
|
North West
|
£164,571
|
£130,121
|
£50,145
|
26%
|
228%
|
|
West Midlands Region
|
£198,513
|
£142,190
|
£60,954
|
40%
|
226%
|
|
North East
|
£128,901
|
£120,955
|
£46,999
|
7%
|
174%
|
|
|
|
|
|
|
|
|
London boroughs
|
|||||
|
Location
|
2019 AveHP
|
2009 AveHP
|
1999 AveHP
|
10 year change
|
20 year change
|
|
Hackney
|
£556,561
|
£282,241
|
£105,533
|
97%
|
427%
|
|
Waltham Forest
|
£431,537
|
£204,935
|
£83,822
|
111%
|
415%
|
|
Newham
|
£363,456
|
£188,217
|
£74,526
|
93%
|
388%
|
|
Lewisham
|
£410,350
|
£211,308
|
£84,695
|
94%
|
385%
|
|
Barking and Dagenham
|
£299,686
|
£156,447
|
£65,321
|
92%
|
359%
|
|
City of London
|
£783,417
|
£383,418
|
£171,300
|
104%
|
357%
|
|
Haringey
|
£548,829
|
£276,214
|
£120,083
|
99%
|
357%
|
|
Southwark
|
£498,672
|
£261,151
|
£110,268
|
91%
|
352%
|
|
City of Westminster
|
£956,750
|
£532,097
|
£214,043
|
80%
|
347%
|
|
Camden
|
£834,749
|
£454,628
|
£191,091
|
84%
|
337%
|
|
Lambeth
|
£508,349
|
£267,337
|
£116,616
|
90%
|
336%
|
|
Brent
|
£484,770
|
£264,402
|
£112,157
|
83%
|
332%
|
|
Greenwich
|
£391,560
|
£210,323
|
£90,879
|
86%
|
331%
|
|
Merton
|
£507,900
|
£271,598
|
£121,901
|
87%
|
317%
|
|
Islington
|
£631,679
|
£345,284
|
£155,590
|
83%
|
306%
|
|
Wandsworth
|
£588,820
|
£340,373
|
£145,340
|
73%
|
305%
|
|
Kensington And Chelsea
|
£1,256,713
|
£705,188
|
£311,455
|
78%
|
303%
|
|
Redbridge
|
£415,068
|
£232,764
|
£102,940
|
78%
|
303%
|
|
Havering
|
£364,713
|
£205,962
|
£92,889
|
77%
|
293%
|
|
Bexley
|
£338,058
|
£189,051
|
£86,778
|
79%
|
290%
|
|
Tower Hamlets
|
£438,332
|
£258,248
|
£113,035
|
70%
|
288%
|
|
Enfield
|
£394,057
|
£221,993
|
£101,987
|
78%
|
286%
|
|
Barnet
|
£520,386
|
£299,103
|
£136,005
|
74%
|
283%
|
|
Croydon
|
£365,763
|
£203,706
|
£97,173
|
80%
|
276%
|
|
Kingston upon Thames
|
£486,237
|
£266,774
|
£129,697
|
82%
|
275%
|
|
Ealing
|
£473,336
|
£264,042
|
£126,278
|
79%
|
275%
|
|
Hillingdon
|
£405,173
|
£228,276
|
£108,925
|
77%
|
272%
|
|
Sutton
|
£373,196
|
£212,118
|
£100,870
|
76%
|
270%
|
|
Bromley
|
£438,406
|
£249,909
|
£120,874
|
75%
|
263%
|
|
Hammersmith and Fulham
|
£718,439
|
£435,456
|
£198,901
|
65%
|
261%
|
|
Hounslow
|
£402,167
|
£236,243
|
£112,074
|
70%
|
259%
|
|
Richmond upon Thames
|
£650,883
|
£369,390
|
£181,772
|
76%
|
258%
|
|
Harrow
|
£449,686
|
£263,036
|
£126,688
|
71%
|
255%
|
|
|
|
|
|
|
|
|
Best areas for 10 year growth outside of London
|
|
|
|||
|
Location
|
2019 AveHP
|
2009 AveHP
|
10 year change
|
|
|
|
Cambridge
|
£435,409
|
£242,741
|
79%
|
|
|
|
Hertsmere
|
£462,457
|
£257,956
|
79%
|
|
|
|
Three Rivers
|
£514,591
|
£289,942
|
77%
|
|
|
|
City of Bristol
|
£280,437
|
£158,796
|
77%
|
|
|
|
Slough
|
£296,956
|
£168,343
|
76%
|
|
|
|
Harlow
|
£273,824
|
£156,433
|
75%
|
|
|
|
Watford
|
£347,013
|
£198,681
|
75%
|
|
|
|
St Albans
|
£506,036
|
£289,965
|
75%
|
|
|
|
Welwyn Hatfield
|
£391,313
|
£224,325
|
74%
|
|
|
|
Southend-on-Sea
|
£285,440
|
£163,819
|
74%
|
|
|
|
|
|
|
|
|
|
|
Best areas for 20 year growth outside of London
|
|
|
|||
|
Location
|
2019 AveHP
|
1999 AveHP
|
20 year change
|
|
|
|
Manchester
|
£181,071
|
£39,835
|
355%
|
|
|
|
Thanet
|
£236,991
|
£53,005
|
347%
|
|
|
|
Thurrock
|
£267,574
|
£60,514
|
342%
|
|
|
|
Brighton and Hove
|
£364,493
|
£83,851
|
335%
|
|
|
|
Southend-on-Sea
|
£285,440
|
£65,811
|
334%
|
|
|
|
City of Bristol
|
£280,437
|
£65,352
|
329%
|
|
|
|
Hastings
|
£214,199
|
£50,073
|
328%
|
|
|
|
Basildon
|
£306,297
|
£72,183
|
324%
|
|
|
|
Rochford
|
£349,442
|
£83,248
|
320%
|
|
|
|
Corby
|
£185,821
|
£45,211
|
311%
|
|
|


