


Tyne and Wear rents vary by £76 from Metro station to station
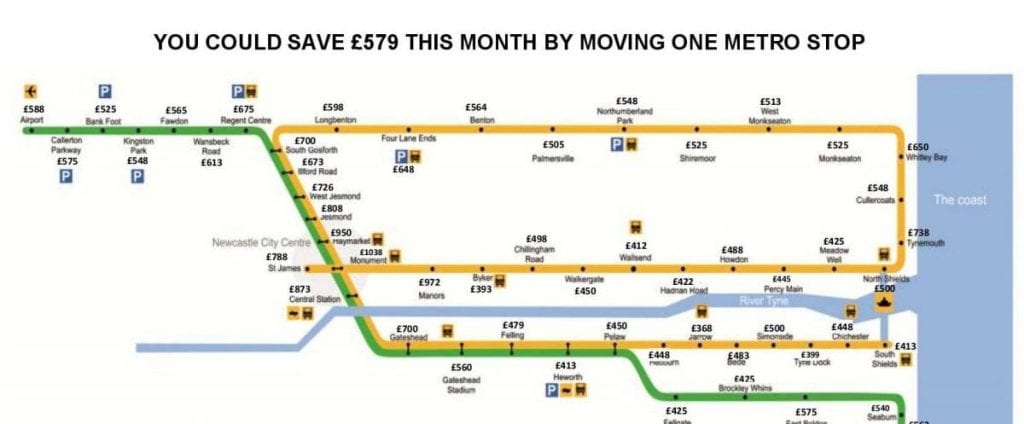
- Moving just one Metro stop saves you an average £76 every month – and could save you as much as £579.
- Jesmond is most expensive place to rent outside of central Newcastle – Byker is still cheapest.

This month’s Tyne and Wear Rent Map from property firm KIS – which shows what the Metro Map would look like if the names of the stations were replaced with the average monthly cost of renting a home there – shows rents varying by an average of £76 from station to station.
Jesmond (£808) beats Tynemouth (£738) to become most expensive place outside of central Newcastle to rent, followed by West Jesmond (£726) and South Gosforth (£700).
Whitley Bay (£650) drops out of this month’s top five expensive places to rent having being fourth most expensive in February. Gateshead (£700) which fell to seventh two months ago returns to the top five in its place.
Byker (£393) is once again the cheapest place to rent, followed by Tyne Dock (£399), Wallsend (£412), Heworth and South Shields (£413) and Fellgate (£425).
The map shows the typical cost per month of renting a two-bedroom property within a quarter of a mile of every one of the Metro’s 60 stations – revealing which areas are Tyne and Wear’s property hotspots and where renters can find a bargain.
The research shows that the biggest single change in rent from station to station continues to occur between Manors and Byker, with a price difference of £579 a month.
The research shows that excluding central Newcastle, the top five most expensive places to rent in Tyne and Wear on a per calendar month basis (last report’s position in brackets) are:
- Jesmond (2) – £808
- Tynemouth (3) – £738
- West Jesmond (1) – £726
- Gateshead/South Gosforth (-/5) – £700
- Ilford Road (-) – £673
The cheapest five areas to rent on the other hand are:
- Byker (1) – £393
- Tyne Dock (5) – £399
- Wallsend (-) – £412
- Heworth/South Shields (4/-)- £413
- Meadow Well/Fellgate(-/-) – £425
The largest differences from station to station are:
- £579 (Manors to Byker)
- £250 (St James to Monument)
- £238 (Tynemouth to North Shields)
- £190 (Tynemouth to Cullercoats)
- £184 (Manors to St James)
Ajay Jagota, Managing Director of KIS and founder of insurance backed deposit-free renting solution D_Lighted responded to the figures:
He said:
“Newcastle has this week been named one of the places where it pays most to buy instead of renting, but if you’re looking to save up the deposit you need to do that it will really help to know where to get the best value rent possible.
“Like every month you can’t help but be amazed by the changes in rent from station to station across the Metro system – just look at the difference of £115 between Bede and Jarrow. It’s just a two minutes by train but a difference of almost £1400 a year in rent.
“What’s also really noticeable is how much average rents can change in an area from month to month. With such a highly-focussed analysis such as ours there’s bound to be a little volatility in the figures, but you can’t ignore the fact that out of the five cheapest places to rent in Tyne and Wear, four weren’t in that list last time we collected this data.
“At the other end of the spectrum, we’ve had months when prices in Jesmond and West Jesmond are all-but identical. This month there’s a difference of £82. Even in our more expensive areas there are bargains to be had if you know where to look.
“These aren’t the only expenses you need to consider with renting either. Rental despot costs can be one-and-a-half times the monthly rent, and even though agents now need to be more transparent with fees, you’ll need to have the cash to cover other move-in costs besides.”
You May Also Enjoy
Tenant demand strong, landlord supply shrinking

Why Join a Letting Agents Association?

House price growth remained subdued in July

Rent hikes and tighter tenant checks as landlord costs climb
North-South divide for time to move as Londoners see longest wait
