


UK postcode study identifies where buyers get the most space for their money
New analysis has revealed the best-value postcodes for buyers: One UK town offers FOUR times more space than the national average.
The study, compiled by the experts at Sell House Fast, analysed postcodes across England and Wales to identify where buyers get the most space for their money.
Where £100,000 buys the most space in the UK:
|
Rank |
Postcode |
Local authority |
Average price |
Average floor area (m²) |
Average price per m² |
Average m² per £100,000 |
|
1 |
DN32 |
North East Lincolnshire |
£112,266 |
89.93 |
£1,275 |
78.4 |
|
2 |
NE17 |
Northumberland |
£107,178 |
80.61 |
£1,377 |
72.6 |
|
3 |
LA18 |
Cumberland |
£136,306 |
97.81 |
£1,398 |
71.5 |
|
4 |
NP13 |
Caerphilly |
£117,533 |
86.99 |
£1,409 |
71.0 |
|
5 |
SR4 |
Sunderland |
£123,017 |
85.19 |
£1,531 |
65.3 |
|
6 |
CA25 |
Cumberland |
£158,386 |
106.77 |
£1,539 |
65.0 |
|
7 |
NE37 |
Sunderland |
£125,608 |
81.06 |
£1,569 |
63.7 |
|
8 |
TS6 |
Redcar and Cleveland |
£134,641 |
87.10 |
£1,575 |
63.5 |
|
9 |
DH5 |
County Durham |
£142,005 |
90.87 |
£1,589 |
62.9 |
|
10 |
SA13 |
Neath Port Talbot |
£153,073 |
99.28 |
£1,618 |
61.8 |
-
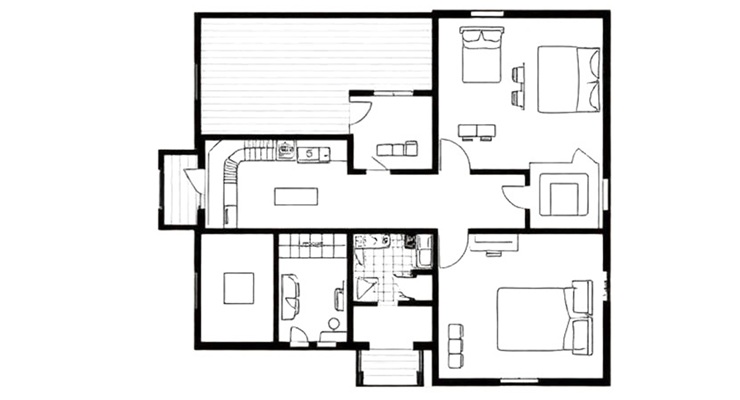
DN32 (North East Lincolnshire), 78.4 m2 per £100,000
Located in Grimsby, this postcode offers the highest value for money, with 78.4 m² for every £100,000 spent, almost 50 m² more than the national average. With an average house price of just over £112,000 (the third lowest in the country), buyers are getting nearly four times the space compared to the national average.
-
NE17 (Northumberland), 72.6 m2 per £100,000
The NE17 postcode, covering villages like Chopwell and Blackhall Mill near Newcastle, offers great value at 72.6 m² per £100,000, more than double the UK average of 28.6 m². The average house price here is £107,178, making it the cheapest in this study.
-
LA18 (Cumberland), 71.5 m2 per £100,000
West Cumbria’s LA18 postcode, centred on Millom, ranks third with 71.5 m² per £100,000. Despite this, the average house price is slightly higher at £136,000, placing it 12th in affordability.
Further findings:
-
Least space for money: Westminster’s W1 postcode offers just 2.5 m² per £100,000.
-
National average: Homes across the UK cost £4,558 per m² and average 99.98 m², meaning 28.6 m² of space per £100,000 spent.
-
Regional disparity: There is almost double (45.5%) the average square metreage per £100,000 in the North compared to the South.
You May Also Enjoy
UK postcode study identifies where buyers get the most space for their money
The graduate shortage: who will value Britain’s homes in 2030?

62% of letting agents failing to comply
UK house prices sit above pandemic market peak

Energy efficient upgrades now an essential home feature
