


34% of income spent on renting – Here’s the best rental markets to maximise your money
Leading lettings platform, Howsy, has looked at where across the UK is home to the best rental market when it comes to the average cost of renting as a percentage of the average salary on offer.
Howsy looked at government data on rental costs across England, Scotland, Wales and Northern Ireland and ONS data on the average salary in each area to highlight which rental market is the most affordable when it comes to the level of disposable income left after putting a roof over your head.
The research shows that at the top line, Wales in the most affordable nation with rental costs accounting for just 30% of the average monthly salary while across the UK as a whole this increases to 34%.
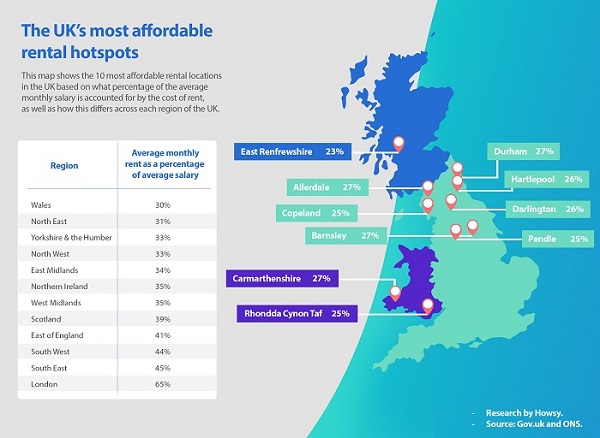
The North East is the most affordable region after Wales 31% of income spent on rental costs. London is, of course, bottom of the affordability scale with the average cost of renting accounting for an eye-watering 65% of the average salary.
On a local level, East Renfrewshire in Scotland is the UK’s best rental market for tenants with the average rental cost of £584 a month accounting for just 23% of the average wage of £2,509.
Copeland is the second most affordable with just ¼ of the average wage spent on renting, along with Rhondda Cynon Taf and Pendle.
Hartlepool and Darlington trail marginally behind with 26% of income spent on rent, while Allerdale, Carmarthenshire, Barnsley, and Country Durham are home to a rental cost accounting for 27% of the average income.
Hackney is the least tenant friendly with a whopping 83% of the average salary in the borough spent on renting. While London does account for 70% of the top 10 least affordable, Oxford (70%), Brighton (66%) and Elmbridge 66%) also make the list.
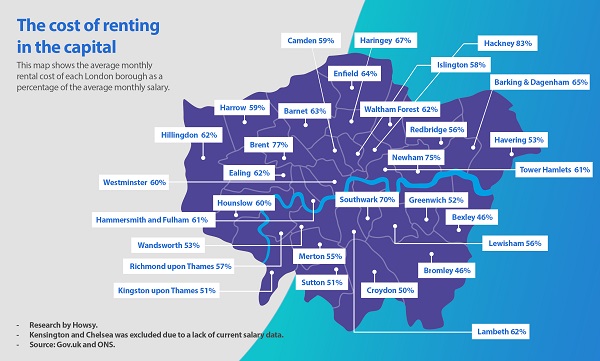
The most ‘affordable’ locations to rent in the capital are still above the UK average but Bromley and Bexley offer the best pick with the average rental cost accounting for 46% of the average salary.
Founder and CEO of Howsy, Calum Brannan, commented:
“We tend to put a lot of focus on the negatives of the UK lettings market but while top-line affordability may be an issue for many, there are plenty of areas where renting isn’t such a financial burden.
Maximising your disposable income in any part of the UK is the key to living a happy life in the rental sector and it pays to do your research before making a move to ensure you can not only cover the cost of renting, but you aren’t left high and dry once you have.
These are the best areas to look to in order to do this, but we appreciate for those working in London, a commute from East Renfrewshire is probably a tad unrealistic. However, we wanted to highlight the diversity of the UK rental sector and reassure those looking to rent that there are plenty of relative pockets of affordability across the nation.”
|
By Country
|
|
|
Location
|
Average Rent as % of Average Salary – Per Month
|
|
WALES
|
30%
|
|
NORTHERN IRELAND
|
35%
|
|
SCOTLAND
|
39%
|
|
ENGLAND
|
42%
|
|
UNITED KINGDOM
|
34%
|
|
|
|
|
By Region
|
|
|
Location
|
Average Rent as % of Average Salary – Per Month
|
|
WALES
|
30%
|
|
NORTH EAST
|
31%
|
|
YORKSHIRE AND THE HUMBER
|
33%
|
|
NORTH WEST
|
33%
|
|
EAST MIDLANDS
|
34%
|
|
NORTHERN IRELAND
|
35%
|
|
WEST MIDLANDS
|
35%
|
|
SCOTLAND
|
39%
|
|
EAST OF ENGLAND
|
41%
|
|
SOUTH WEST
|
44%
|
|
SOUTH EAST
|
45%
|
|
LONDON
|
65%
|
|
Rankings – Top 10 most affordable
|
|
|
Location
|
Average Rent as % of Average Salary – Per Month
|
|
East Renfrewshire
|
23%
|
|
Copeland
|
25%
|
|
Rhondda Cynon Taf
|
25%
|
|
Pendle
|
25%
|
|
Hartlepool
|
26%
|
|
Darlington
|
26%
|
|
Allerdale
|
27%
|
|
Carmarthenshire
|
27%
|
|
Barnsley
|
27%
|
|
County Durham
|
27%
|
|
*Northern Irish data only available on a national level and not on a regional basis.
|
|
|
Rankings – Top 10 least affordable
|
|
|
Location
|
Average Rent as % of Average Salary – Per Month
|
|
Hackney
|
83%
|
|
Brent
|
77%
|
|
Newham
|
75%
|
|
Southwark
|
70%
|
|
Oxford
|
70%
|
|
Haringey
|
67%
|
|
Brighton and Hove
|
66%
|
|
Elmbridge
|
66%
|
|
City of London
|
65%
|
|
Barking and Dagenham
|
65%
|
|
All London Boroughs
|
|
|
Location
|
Average Rent as % of Average Salary – Per Month
|
|
Bromley
|
46%
|
|
Bexley
|
46%
|
|
Croydon
|
50%
|
|
Sutton
|
51%
|
|
Kingston upon Thames
|
51%
|
|
Greenwich
|
52%
|
|
Havering
|
53%
|
|
Wandsworth
|
53%
|
|
Merton
|
55%
|
|
Lewisham
|
56%
|
|
Redbridge
|
56%
|
|
Richmond upon Thames
|
57%
|
|
Islington
|
58%
|
|
Harrow
|
59%
|
|
Camden
|
59%
|
|
Hounslow
|
60%
|
|
Westminster
|
60%
|
|
Tower Hamlets
|
61%
|
|
Hammersmith and Fulham
|
61%
|
|
Waltham Forest
|
62%
|
|
Ealing
|
62%
|
|
Lambeth
|
62%
|
|
Hillingdon
|
62%
|
|
Barnet
|
63%
|
|
Enfield
|
64%
|
|
Barking and Dagenham
|
65%
|
|
Haringey
|
67%
|
|
Southwark
|
70%
|
|
Newham
|
75%
|
|
Brent
|
77%
|
|
Hackney
|
83%
|
|
Kensington and Chelsea
|
No wage data
|
|
Sources
|
|
|
Salary / earnings data
|
|
|
Rents data
|
|
You May Also Enjoy

House price growth remained subdued in July

Rent hikes and tighter tenant checks as landlord costs climb
North-South divide for time to move as Londoners see longest wait

Dispelling the top five biggest letting agent myths

Bank of England Holds Interest Rates at 3.75%
