London transactions bear the brunt of Brexit slowdown

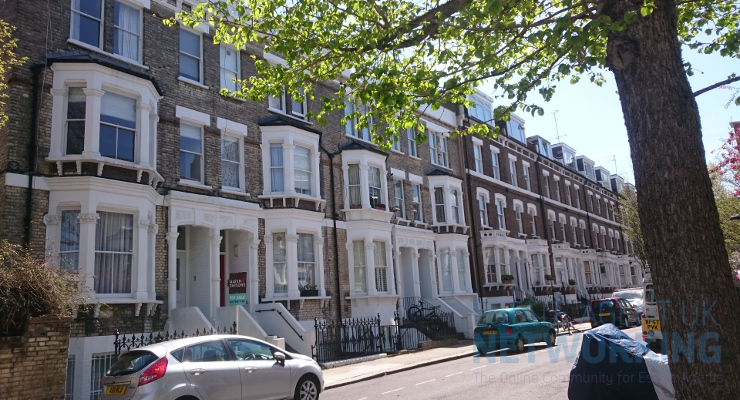
London boroughs have seen property transactions fall by a greater proportion than the rest of the UK since the EU Referendum vote on 23rd June 2016, analysis by national fast sale estate agent Springbok Properties has revealed.
However many areas in Wales, Northern Ireland, Scotland and the North of England are seeing more transactions than before the vote.
Using Land Registry data, the research compared the number of transactions in the two years and nine months before the Brexit vote to the same timeframe afterward.
London and the South hit hard
The biggest drop across the UK was in the London borough of Kensington and Chelsea (-42.4%), followed by Islington (-35.4%), City of Westminster (-31.9%) and Enfield (-30.2%).
London boroughs made up the rest of the top 10, with the exception of nearby Watford (-27.5%) in Hertfordshire, in 10th place.
Other areas that recorded big slowdowns were typically in the South of England, like Slough (-27.2%), Oxford (-25.9%) and Brighton and Hove (-24.5%).
Rest of the UK on the up
Not that transactions have slowed down everywhere.
Two areas in Wales have seen the biggest increase in transactions since the Brexit vote, Torfaen (30.6%) and Newport (25.1%).
Other strong performers were Knowsley in Merseyside (23.5%), Antrim and Newtownabbey in Northern Ireland (21.9%), as well as East Lothian (21.8%) and Renfrewshire (21.3%), both in Scotland.
Looking at transaction levels by country in the United Kingdom, the biggest drop in transactions happened in England at -5.2%, while Northern Ireland saw the sharpest increase of 11.6%.
Wales saw an 8.4% uplift in activity, while transactions in Scotland increased by 5.7%.
Founder and CEO of Springbok Properties, Shepherd Ncube, commented:
“The decline of the UK property market as a result of Brexit uncertainty has been well documented and particularly in England, this decline has been spearheaded by London and the South East.
However, the market landscape is a vast and varied one and there are many pockets across the UK that have not only weathered the storm, but have actually seen more transactions since the EU Referendum then in the same time period preceding it.
These have largely been the more affordable areas where the reality between seller expectation and what buyers are willing to pay is far smaller than the capital and surrounding areas. As a result, less indecision on the part of both buyers and sellers has seen the market continue to operate as normal while other areas have stalled.”
|
Sales volumes nationally
|
|
|
England
|
-5.2%
|
|
Scotland
|
5.7%
|
|
Wales
|
8.4%
|
|
Northern Ireland
|
11.6%
|
|
United Kingdom
|
-2.7%
|
|
|
|
|
Biggest increases in sales volume since the vote
|
|
|
Location / Area
|
Change in Sales Volume Pre and Post Brexit)
|
|
Torfaen
|
30.6%
|
|
Newport
|
25.1%
|
|
Knowsley
|
23.5%
|
|
Antrim and Newtownabbey
|
21.9%
|
|
East Lothian
|
21.8%
|
|
Renfrewshire
|
21.3%
|
|
Liverpool
|
20.0%
|
|
Fermanagh and Omagh
|
18.1%
|
|
Wigan
|
18.0%
|
|
Barnsley
|
17.3%
|
|
Biggest decreases in sales volume since the vote
|
|
|
Location / Area
|
Change in Sales Volume Pre and Post Brexit)
|
|
Kensington And Chelsea
|
-42.4%
|
|
Islington
|
-35.4%
|
|
City of Westminster
|
-31.9%
|
|
Enfield
|
-30.2%
|
|
Brent
|
-29.8%
|
|
Haringey
|
-29.5%
|
|
Kingston upon Thames
|
-28.4%
|
|
Camden
|
-28.2%
|
|
Lambeth
|
-28.0%
|
|
Watford
|
-27.5%
|
|
Biggest decreases in sales volume since the vote (Exc London)
|
|
|
Location / Area
|
Change in Sales Volume Pre and Post Brexit)
|
|
Watford
|
-27.5%
|
|
Slough
|
-27.2%
|
|
Oxford
|
-25.9%
|
|
Brighton and Hove
|
-24.5%
|
|
Windsor and Maidenhead
|
-24.2%
|
|
Elmbridge
|
-23.8%
|
|
Three Rivers
|
-23.7%
|
|
St Albans
|
-22.4%
|
|
City of Aberdeen
|
-22.3%
|
|
Epsom and Ewell
|
-22.0%
|
|
Data looks at transaction levels in the 2 years and 9 months since the vote, compared to the same time period prior to the vote.
|
|
You May Also Enjoy
Property values climb in Q1
Propertymark backs move to commonhold
Phasing out leasehold flats is the right thing to do

Deposit Disputes Are Rising – Are Baths to Blame?

Inheritance tax haul grows as more families are dragged into the tax net