


Where’s best to buy a new-build and why?
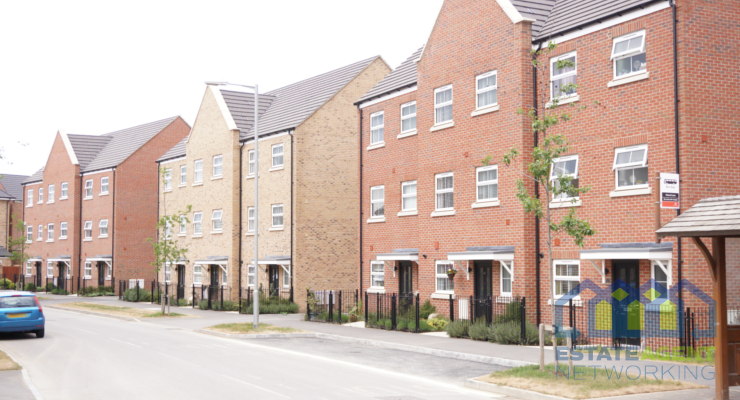
The latest research by property developer, StripeHomes, has looked at where offers the best buy when it comes to the new-build market, based on affordability, house price growth and the time taken to recoup a new-build price premium.
New-build price premiums
The research shows that currently, the average new-build in the UK costs £302,749, 33% more than the existing UK house price.
Regionally, this new-build price premium is highest in the North East (60%), the North West (45%) and the East of England (34%), while London is home to the smallest gap at 10%.
However, on a local level, it’s Harlow in Essex that takes the top spot for the largest new-build price premium. Buying new in Harlow will currently cost you £548,535, 104% more than the average price for an existing property in the area.
Blaenau Gwent (94%), Gravesham (91%), Preston (99%) and Torfaen (86%) are also home to some of the highest new-build price premiums in the UK.
So why buy a new-build?
Most affordable
Other than the obvious advantages of new-build quality, there are as many as 40 areas of the UK where the average new-build is currently cheaper than buying an existing home. Surrey Heath is home to the biggest discount, with the average new-build costing £281,973; -27% cheaper.
In terms of straight-up affordability, Hyndburn is home to the lowest average new-build cost (£97,939), along with North Ayrshire (£115,305) and Burnley (£122,193).
Higher house price growth
However, perhaps the biggest advantage of buying new is the appreciation in property values. In the last year, the average UK new-build has increased by 7.3% compared to just 1.5% for existing homes.
According to professional estate agents from Nexa Properties, new-build house price growth has increased by between six and eight percent across every region of the UK in the last year, while the existing market has seen growth hitting just three percent in the best performing regions.
The strongest new-build growth compared to the existing market is in London, where new-builds are up 7.6% to 1.2% for existing homes.
The South East, East of England, South West and North East have also seen some of the strongest new-build house price growth when compared to that seen in the existing market.
At this rate of growth, it would take just 3.4 years for a new-build homebuyer recoup the additional cost of buying new through the appreciation of their property’s value.
In London, it would take the average new-build buyer just 1.2 years to see their property appreciate to the point they would recoup the new-build price premium paid. Even in the North East where new-builds carry the largest price premium, the current annual rate of growth means it would take just five years for a new-build to increase in value by the £73,000 premium initially paid.
|
Primary level – nations
|
||||||
|
Location
|
Average Existing House Price
|
Existing Annual Growth (%)
|
Average New-Build House Price
|
New-Build Annual Growth (%)
|
New-Build Premium
|
Years to make up new-build premium
|
|
England
|
£243,890
|
1.2%
|
£323,532
|
7.1%
|
33%
|
3.5
|
|
Wales
|
£159,380
|
2.5%
|
£230,600
|
9.7%
|
45%
|
3.2
|
|
Scotland
|
£150,589
|
2.2%
|
£225,417
|
9.2%
|
50%
|
3.6
|
|
Northern Ireland
|
£133,683
|
3.9%
|
£168,273
|
3.2%
|
26%
|
6.3
|
|
United Kingdom
|
£228,021
|
1.5%
|
£302,749
|
7.3%
|
33%
|
3.4
|
|
Secondary level – regions
|
||||||
|
Location
|
Average Existing House Price
|
Existing Annual Growth (%)
|
Average New-Build House Price
|
New-Build Annual Growth (%)
|
New-Build Premium
|
Years to make up new-build premium
|
|
North East
|
£123,066
|
1.6%
|
£196,325
|
7.5%
|
60%
|
5.0
|
|
North West
|
£161,061
|
1.8%
|
£232,775
|
6.9%
|
45%
|
4.5
|
|
East of England
|
£283,760
|
0.0%
|
£380,571
|
6.1%
|
34%
|
4.1
|
|
East Midlands
|
£190,123
|
2.0%
|
£278,476
|
7.8%
|
46%
|
4.1
|
|
West Midlands
|
£197,038
|
2.9%
|
£287,079
|
8.2%
|
46%
|
3.8
|
|
Yorkshire and The Humber
|
£161,353
|
2.3%
|
£219,013
|
8.1%
|
36%
|
3.3
|
|
South East
|
£318,936
|
-0.1%
|
£396,926
|
6.3%
|
24%
|
3.1
|
|
South West
|
£253,623
|
0.8%
|
£319,878
|
6.9%
|
26%
|
3.0
|
|
London
|
£474,660
|
1.2%
|
£521,136
|
7.6%
|
10%
|
1.2
|
|
Top 10 Largest New-Build Price Premiums in the UK
|
||||||
|
Location
|
Average New-Build House Price
|
Average Existing House Price
|
New-Build Premium
|
|||
|
Harlow
|
£548,534
|
£268,357
|
104.4%
|
|||
|
Blaenau Gwent
|
£177,804
|
£91,465
|
94.4%
|
|||
|
Gravesham
|
£535,257
|
£279,967
|
91.2%
|
|||
|
Preston
|
£237,236
|
£126,463
|
87.6%
|
|||
|
Torfaen
|
£275,138
|
£148,023
|
85.9%
|
|||
|
Rochford
|
£613,308
|
£331,910
|
84.8%
|
|||
|
West Dunbartonshire
|
£196,678
|
£107,822
|
82.4%
|
|||
|
Middlesbrough
|
£192,657
|
£105,953
|
81.8%
|
|||
|
Merthyr Tydfil
|
£188,861
|
£106,256
|
77.7%
|
|||
|
Nuneaton and Bedworth
|
£305,454
|
£172,579
|
77.0%
|
|||
|
Top 10 Lowest New-Build Price Premiums in the UK
|
||||||
|
Location
|
Average New-Build House Price
|
Average Existing House Price
|
New-Build Premium
|
|||
|
Surrey Heath
|
£281,973
|
£386,142
|
-27.0%
|
|||
|
Richmond upon Thames
|
£550,141
|
£668,800
|
-17.7%
|
|||
|
St Albans
|
£422,847
|
£512,873
|
-17.6%
|
|||
|
Canterbury
|
£255,371
|
£304,518
|
-16.1%
|
|||
|
West Devon
|
£223,562
|
£263,509
|
-15.2%
|
|||
|
Oxford
|
£366,351
|
£428,105
|
-14.4%
|
|||
|
Kensington and Chelsea
|
£1,078,902
|
£1,257,912
|
-14.2%
|
|||
|
Harrow
|
£398,486
|
£454,232
|
-12.3%
|
|||
|
Lichfield
|
£224,178
|
£254,422
|
-11.9%
|
|||
|
Brighton and Hove
|
£329,724
|
£368,864
|
-10.6%
|
|||
|
Most Affordable New-Build House Prices
|
||||||
|
Location
|
Average New-Build House Price
|
|||||
|
Hyndburn
|
£97,939
|
|||||
|
North Ayrshire
|
£115,305
|
|||||
|
Burnley
|
£122,193
|
|||||
|
East Ayrshire
|
£140,310
|
|||||
|
County Durham
|
£148,653
|
|||||

You May Also Enjoy

£50k hit when climbing the property ladder
Conveyancing causes more stress than property chains

Britain’s most competitive summer rental hotspots

The 5 tasks lettings agents won’t trust to AI

Foxtons Lettings Market Index – August 2026