


London has been the most affordable city for renting over the last five years
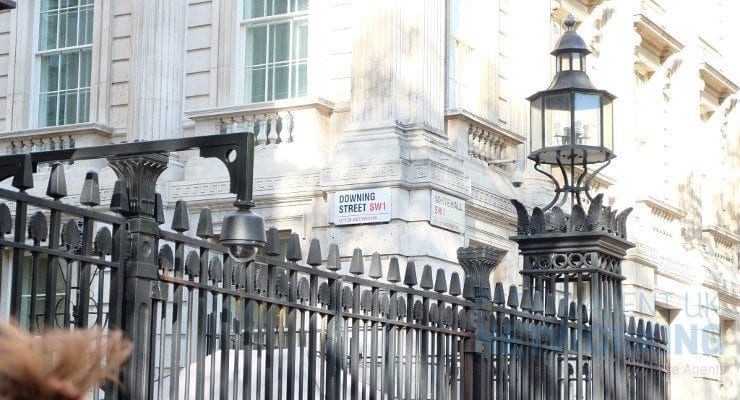
According to the latest rental market analysis from deposit replacement scheme, Ome, London has been the most affordable city for renting in England and Wales over the last five years when taking into consideration the increasing cost of renting.
Ome dissected rental market statistics from the Office for National Statistics (ONS) across 19 major cities in England and Wales to see how the cost of renting in each area had increased over the last five years, as well as the average yearly increase during that time.
The data shows that as a whole across England and Wales, the cost of renting has increased by 8% in five years; increasing by an average of 2% annually.
While London remains the most expensive region for flat out rental costs (£1,697), the city has proved the most affordable where rental increases are concerned. The average rent in the capital has increased by just 1.3% in the last five years, an average annual increase of just 0.3%.
Leicester has seen the largest increase in rental costs with tenants seeing a 26.8% increase in the last five years, increasing at a rate of 6.1% a year.
Oxford (6%), Cardiff (5.8%), Bristol (5.7%) and Nottingham (4.9%) have also seen some of the largest average annual increases in rent, with the cost of renting in each city increasing between 19.7% and 25.3% in the last five years.
Not only has London seen the lowest increase in rental outgoings, the capital has also seen a reduction where the initial financial barrier of renting is concerned.
With the recent ban on tenant fees capping rental deposits at five weeks rent, the cost of a rental deposit in London has actually declined -11.4% in the last five years, down -2.9% a year on average. Of course, this still requires tenants to stump up an average of £1,958 and this remains the largest deposit sum across England and Wales.
Cardiff, Newport and Leicester have seen the largest increases in the initial cost of a rental deposit, up 2.8%-5.9% on average each year with a total increase of 10.9%-25.2% over the last five years.
|
Location
|
Current Average Rent
|
Average Annual Change (Last 5 Years)
|
Total Change (Last 5 Years)
|
|
Leicester
|
£629
|
6.1%
|
26.8%
|
|
Oxford
|
£1,509
|
6.0%
|
25.3%
|
|
Cardiff
|
£746
|
5.8%
|
25.2%
|
|
Bristol
|
£1,140
|
5.7%
|
24.6%
|
|
Nottingham
|
£657
|
4.9%
|
19.7%
|
|
Newcastle
|
£674
|
4.5%
|
16.0%
|
|
Newport
|
£611
|
4.5%
|
18.5%
|
|
Manchester
|
£822
|
4.3%
|
17.9%
|
|
Portsmouth
|
£847
|
4.0%
|
16.5%
|
|
Bournemouth
|
£867
|
2.9%
|
11.7%
|
|
Cambridge
|
£1,253
|
2.9%
|
11.7%
|
|
Birmingham
|
£724
|
2.6%
|
10.9%
|
|
Liverpool
|
£532
|
2.2%
|
9.0%
|
|
Swansea
|
£567
|
2.0%
|
8.0%
|
|
Sheffield
|
£629
|
2.0%
|
8.3%
|
|
Leeds
|
£774
|
1.7%
|
5.7%
|
|
Southampton
|
£799
|
1.1%
|
4.4%
|
|
Plymouth
|
£604
|
1.0%
|
4.0%
|
|
London
|
£1,697
|
0.3%
|
1.3%
|
|
England and Wales
|
£695
|
2%
|
8%
|
|
Location
|
Current Average Rental Deposit
|
Average Annual Change (Last 5 Years)
|
Total Change (Last 5 Years)
|
|
Cardiff
|
£1,546
|
5.9%
|
25.2%
|
|
Newport
|
£1,267
|
4.5%
|
18.5%
|
|
Leicester
|
£726
|
2.8%
|
10.9%
|
|
Oxford
|
£1,741
|
2.7%
|
9.6%
|
|
Bristol
|
£1,315
|
2.3%
|
9.0%
|
|
Swansea
|
£1,175
|
2.1%
|
8.0%
|
|
Nottingham
|
£758
|
1.7%
|
4.7%
|
|
Manchester
|
£948
|
1.3%
|
3.1%
|
|
Newcastle
|
£778
|
1.0%
|
1.5%
|
|
Portsmouth
|
£977
|
0.6%
|
1.9%
|
|
Bournemouth
|
£1,000
|
-0.1%
|
-2.3%
|
|
Cambridge
|
£1,446
|
-0.4%
|
-2.3%
|
|
Birmingham
|
£835
|
-0.6%
|
-3.0%
|
|
Leeds
|
£893
|
-1.1%
|
-7.5%
|
|
Liverpool
|
£614
|
-1.1%
|
-4.7%
|
|
Sheffield
|
£726
|
-1.1%
|
-5.3%
|
|
Southampton
|
£922
|
-2.1%
|
-8.7%
|
|
Plymouth
|
£697
|
-2.2%
|
-9.1%
|
|
London
|
£1,958
|
-2.9%
|
-11.4%
|
|
England and Wales
|
£1,116
|
1.8%
|
7.4%
|

You May Also Enjoy

Residential projects remain under pressure

Homebuyers hold tight ahead of Autumn Budget

House price growth accelerates in Q2

House prices hold steady despite impact of higher interest rates

Breaking Property News 5/10/26