Commuter hub house price growth outperforming major cities despite travel cost increases
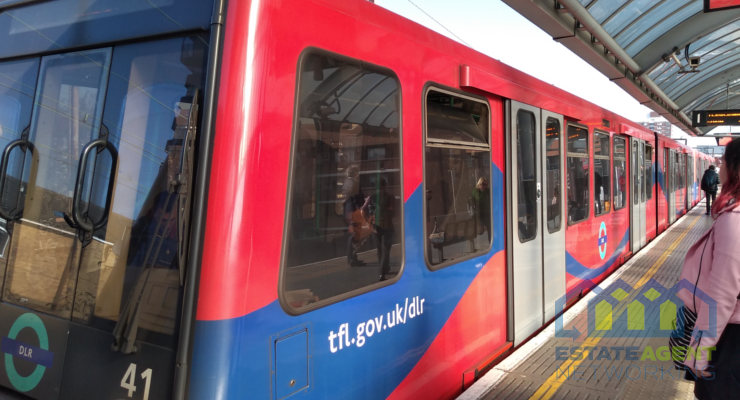
Estate agent comparison website, GetAgent.co.uk, has looked at the cost increase in annual train fares over the last year across a host of commuter towns heading into major cities, highlighting the locations where the local housing market has defied the Brexit blues to register house price growth above and beyond the price increase of a train ticket.
GetAgent.co.uk looked at commuter towns surrounding London, Bristol, Manchester, Leeds, Birmingham and Liverpool, working out the cost increase in an annual train ticket for each over the last year. GetAgent then looked at house price growth during the same period to see where commuters were quids in on property values despite the cost of commuting into a larger city and how this compared to house price growth in each city.
The best of the bunch is Newport in Wales, where the average house price has increased by £7,362 over the last year, while the cost of commuting into Bristol has risen by just £77, an overall increase of £7,285 after commuter costs. In contrast, house prices in Bristol have dropped by £3,602 during the same time period so commuting to Bristol has paid off for Newport homeowners.
Commuting from both Stafford and Kidderminster into Birmingham has also been a good choice for homeowners. Both locations have seen the annual cost of travel increase by £55 and £35 respectively, but with house price growth hitting nearly £6,000 over the last year in both locations, homeowners have seen a total increase of between £5,700-£5,800, compared to just £2,317 in Birmingham.
Homeowners commuting from York have also seen a total increase of £5,011 in house prices once you deduct the £72 increase in train fares, compared to just £2,903 in Leeds as a whole.
Commuting from Widness (£4,871) and Runcorn (£4,852) to Liverpool has also been more profitable for homeowners compared to the £2,670 increase in property values in the main city.
Homeowning commuters in Rochdale (£4,789) and Stockport (£4,629) are far better off than those living in Manchester despite an increase in commuting costs, with property prices in Manchester down by £955 in the last year.
Canterbury has been the most profitable commuter town for homeowners travelling into London. Despite a £172 jump in travel costs, prices are up £4,150 over the last year, £3,978 after the cost of commuting, and a much better performance than London as a whole where prices have dipped by £17,791 in the last year.
The worst commuter town for homeowners is Slough where travel costs have increased by £81 in the last year, while property prices have fallen by £15,904. Despite this combined decline of £15,985, it still comes in less than the £17,791 lost in London property values.
Founder and CEO of GetAgent.co.uk, Colby Short, commented:
“While the increasing value of a property can’t be directly drawn upon in order to stomach the increasing cost of travel, it will certainly be welcomed by those homeowners that have looked to the commuter belts of our major cities.
With prices growth falling or flattening in many major cities across the UK, the choice to commute those extra hours will not only have provided a more affordable foot on the ladder but in many cases, a healthier return on your investment.
Unfortunately, this isn’t the case for some commuter towns around London and Bristol in particular and this will no doubt be more upsetting to homeowners in these areas than the inevitable delays experienced when commuting.
However, for the majority, the obstacles faced on the daily commute have seen them beat the Brexit market blues where property prices growth is concerned at least.”
|
Commuter City
|
Major City
|
Change in Annual Travel Costs
|
Change in Commuter House Price
|
Overall Change in Travel and House Price
|
Price Change in Major City
|
|
Newport (Wales)
|
Bristol
|
£77
|
£7,362
|
£7,285
|
-£3,602
|
|
Stafford
|
Birmingham
|
£55
|
£5,892
|
£5,837
|
£2,317
|
|
Kidderminster
|
Birmingham
|
£35
|
£5,734
|
£5,699
|
£2,317
|
|
York
|
Leeds
|
£72
|
£5,083
|
£5,011
|
£2,903
|
|
Widnes
|
Liverpool
|
£26
|
£4,897
|
£4,871
|
£2,670
|
|
Runcorn
|
Liverpool
|
£45
|
£4,897
|
£4,852
|
£2,670
|
|
Rochdale
|
Manchester
|
£36
|
£4,825
|
£4,789
|
-£955
|
|
Stockport
|
Manchester
|
£25
|
£4,654
|
£4,629
|
-£955
|
|
Canterbury
|
London
|
£172
|
£4,150
|
£3,978
|
-£17,791
|
|
Altrincham
|
Manchester
|
£28
|
£3,970
|
£3,942
|
-£955
|
|
Southport
|
Liverpool
|
£36
|
£3,800
|
£3,764
|
£2,670
|
|
Ashford
|
London
|
£165
|
£3,562
|
£3,397
|
-£17,791
|
|
Macclesfield
|
Manchester
|
£55
|
£3,359
|
£3,304
|
-£955
|
|
Brighton
|
London
|
£145
|
£3,126
|
£2,981
|
-£17,791
|
|
Bolton
|
Manchester
|
£28
|
£2,997
|
£2,969
|
-£955
|
|
Nuneaton
|
Birmingham
|
£62
|
£2,884
|
£2,822
|
£2,317
|
|
Rugby
|
Birmingham
|
£90
|
£2,584
|
£2,494
|
£2,317
|
|
Warrington
|
Liverpool
|
£30
|
£2,300
|
£2,270
|
£2,670
|
|
Halifax
|
Leeds
|
£33
|
£1,180
|
£1,147
|
£2,903
|
|
Guildford
|
London
|
£190
|
£1,042
|
£852
|
-£17,791
|
|
New Brighton
|
Liverpool
|
£22
|
£493
|
£471
|
£2,670
|
|
Huddersfield
|
Leeds
|
£36
|
£440
|
£404
|
£2,903
|
|
Burton upon Trent
|
Birmingham
|
£86
|
-£400
|
-£486
|
£2,317
|
|
Colchester
|
London
|
£159
|
-£513
|
-£672
|
-£17,791
|
|
Bradford
|
Leeds
|
£31
|
-£1,192
|
-£1,223
|
£2,903
|
|
Brentwood
|
London
|
£83
|
-£1,314
|
-£1,397
|
-£17,791
|
|
Woking
|
London
|
£99
|
-£1,329
|
-£1,428
|
-£17,791
|
|
Swindon
|
Bristol
|
£104
|
-£1,442
|
-£1,546
|
-£3,602
|
|
High Wycombe
|
London
|
£108
|
-£1,460
|
-£1,568
|
-£17,791
|
|
Southampton
|
London
|
£178
|
-£1,401
|
-£1,579
|
-£17,791
|
|
Gillingham
|
London
|
£125
|
-£1,934
|
-£2,059
|
-£17,791
|
|
Aylesbury
|
London
|
£127
|
-£1,972
|
-£2,099
|
-£17,791
|
|
Oxford
|
London
|
£159
|
-£1,990
|
-£2,149
|
-£17,791
|
|
Eastbourne
|
London
|
£64
|
-£2,158
|
-£2,222
|
-£17,791
|
|
Crawley
|
London
|
£115
|
-£2,323
|
-£2,438
|
-£17,791
|
|
Chippenham
|
Bristol
|
£60
|
-£3,729
|
-£3,789
|
-£3,602
|
|
Westbury
|
Bristol
|
£71
|
-£3,729
|
-£3,800
|
-£3,602
|
|
Bath
|
Bristol
|
£51
|
-£5,101
|
-£5,152
|
-£3,602
|
|
Luton
|
London
|
£131
|
-£5,708
|
-£5,839
|
-£17,791
|
|
Harrogate
|
Leeds
|
£31
|
-£7,314
|
-£7,345
|
£2,903
|
|
Bracknell
|
London
|
£141
|
-£7,380
|
-£7,521
|
-£17,791
|
|
Cambridge
|
London
|
£156
|
-£7,417
|
-£7,573
|
-£17,791
|
|
Reading
|
London
|
£141
|
-£8,106
|
-£8,247
|
-£17,791
|
|
Milton Keynes
|
London
|
£163
|
-£9,267
|
-£9,430
|
-£17,791
|
|
Slough
|
London
|
£81
|
-£15,904
|
-£15,985
|
-£17,791
|
|
Sources
|
|
|
Average House Price
|
|
|
Train Fare Increases
|
|
|
Season Ticket Costs
|
|


