London boasts biggest property market gap
UK’s property price gaps exposed: London tops with £838k difference between top and bottom of the market
The latest research from eXp UK has revealed the scale of the price divide between the most and least expensive property markets across each region of the UK, with three areas seeing average house price gaps of more than 100%.
eXp UK analysed average house prices at local authority level across each UK region*, identifying the highest and lowest priced markets in each area, before calculating the monetary and percentage difference between the two.
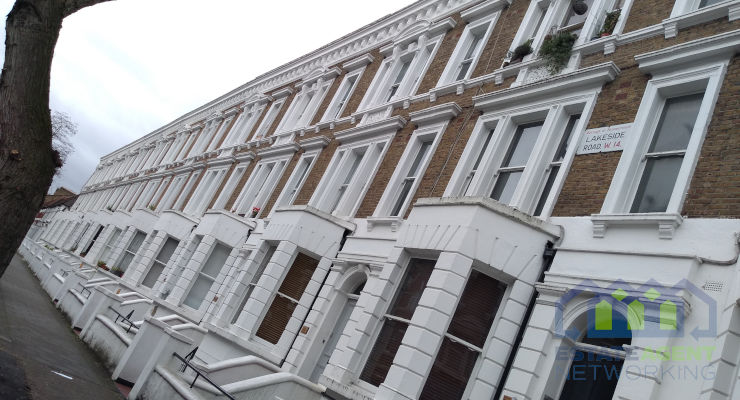
The research shows that London is home to the most significant price disparity between the top and bottom of the market.
In Kensington and Chelsea, the capital’s most expensive market, the average house price sits at £1.2m. In the most affordable area of Barking and Dagenham, the average is just £359,807, marking a difference of £838,488, or 107.6%.
A similarly stark divide can be found in the South East, where Elmbridge ranks as the most expensive local authority with an average price of £749,367, while Southampton is the most affordable at £233,574. This leaves a gap of £515,793, equivalent to 104.9%.
In the East of England, St Albans commands an average price of £626,629, compared to £207,952 in Great Yarmouth: a difference of £418,677, or 100.3%.
Across the North West, Trafford is the most expensive market at £382,490, while Burnley ranks as the most affordable at £127,832. This results in a price gap of £254,658, or 99.8%.
In the West Midlands, Stratford-on-Avon (£393,858) sits at the top of the market, compared to Stoke-on-Trent (£147,404) at the lower end: a difference of £246,454, or 91.1%.
Scotland also shows a notable divide, with average house prices in the City of Edinburgh reaching £293,910, compared to £114,629 in Inverclyde. This is a gap of £179,281, or 87.8%.
In Wales, Monmouthshire (£333,000) is the most expensive local authority, while Blaenau Gwent (£139,073) is the most affordable, creating a difference of £193,927, or 82.2%.
Across Yorkshire & Humber, York leads with an average price of £311,290, compared to £130,691 in the City of Kingston upon Hull – a difference of £180,599, or 81.7%.
The South West sees a smaller, but still substantial, divide, with Cotswold (£417,038) and the City of Plymouth (£217,868) separated by £199,170, or 62.7%.
In the East Midlands, Harborough is the most expensive local authority at £345,101, while Lincoln is the most affordable at £187,688, marking a difference of £157,413, or 59.1%.
The North East records one of the smaller regional gaps, with Northumberland (£210,293) and Hartlepool (£131,219) separated by £79,074, or 46.3%.
Finally, Northern Ireland shows the smallest disparity, where Lisburn and Castlereagh (£231,628) and Mid and East Antrim (£173,261) are separated by just £58,367, or 28.8%.
Head of eXp UK and Europe, Adam Day, commented:
“What this research really highlights is the diversity of the UK housing market. Buyers and sellers are operating in very different landscapes depending on location, which makes local knowledge more important than ever.
While high-demand areas continue to command premium prices, there are still opportunities for buyers to find value in less expensive markets, and for sellers to capitalise on strong demand in their area. Understanding these regional dynamics is key to making confident property decisions today.”
You May Also Enjoy
Here’s how to avoid garden rows this summer
Breaking Property News 16/7/26
Why the postcode can make a big difference to your rebuild costs
New record rents as rental supply falls for first time since 2022