Could Britain’s empty homes house the homeless?
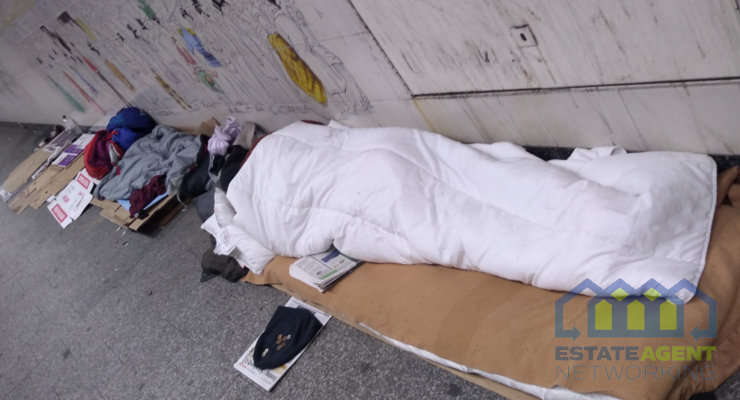
Research by estate agent comparison website, GetAgent.co.uk, has found that by utilising just 41.4% of Britain’s empty homes we could house the homeless.
There are an estimated 320,000 homeless people in Britain according to Shelter while there are some 322,386 homes that are vacant on a long-term basis, having been empty for more than six months.
With the average number of people per dwelling currently at 2.4, the volume of empty homes in Britain is enough to house 773,726 people with just 133,333, or 41.4% of these homes needed to provide a home for those currently going without.
GetAgent.co.uk also looked on a regional level at the number of vacant homes required in each area to house those classified as rough sleepers at 2.4 people to a dwelling and those classified as homeless and relief duty owed, and what this equates to as a percentage of the long-term vacant homes available.
The figures show it would take just two households or 0.5% of the 430 vacant homes in Halton, Cheshire, in order to house the homeless. It would also take less than one percent (0.6%) of vacant housing in Torbay and less than 10 percent in Stevenage, Rutland, Eden, South Staffordshire, Windsor and Maidenhead and Bolsover.
Of course, while some areas could provide housing with vacant properties to spare, this isn’t the case everywhere in Britain.
In Crawley, the number of rough sleepers and those classified as homeless and relief duty owed would need some 414 properties in order to house them, while there is just 30 identified as vacant on a long-term basis.
In Corby, 132 properties would be required while there are just 12 marked as long-term vacant, with Solihull, Westminster and Brent also amongst some of the areas with the highest proportion of homeless to vacant property available.
Founder and CEO of GetAgent.co.uk, Colby Short, commented:
“We know that the number of people living on the streets of Britain is far higher than the current estimates and it’s impossible to tell just how many people are homeless and in need of housing.
But even with these conservative estimates, many areas of Britain would require just a small percentage of the many empty homes available to make a difference when it comes to providing housing for the less fortunate.
Unfortunately, this isn’t the case everywhere and some areas would need far more empty homes to address the issue and even then, it isn’t as clear cut as providing empty housing to those without any at all.
However, we wanted to highlight that at this time of year in particular, there are plenty of empty properties sitting vacant that could be utilised to help those in need.”
|
Data Description
|
Data Point
|
Notes/Sources
|
|
|
Number of homeless
|
320,000
|
||
|
Number of empty homes
|
322,386
|
Total in Britain
|
|
|
England
|
216,186
|
||
|
Wales
|
27,000
|
||
|
Scotland
|
79,200
|
||
|
Average number of people in a household/dwelling
|
2.4
|
||
|
Capacity
|
773,726
|
Vacant homes x People to a household
|
|
|
Vacant homes needed
|
133,333
|
Number of homeless / People to a household
|
|
|
Percentage of vacant homes
|
41.40%
|
Number of vacant homes needed / Number of total vacant homes
|
|
|
By smallest % of vacant dwellings needed
|
|||
|
Location
|
Number of households – Rough sleepers and homeless relief duty owed
|
Long-term vacant dwellings
|
% of vacant homes needed to house homeless
|
|
Halton
|
2
|
430
|
0.5%
|
|
Torbay
|
8
|
1303
|
0.6%
|
|
Stevenage
|
5
|
156
|
2.9%
|
|
Rutland
|
16
|
183
|
8.7%
|
|
Eden
|
42
|
471
|
8.9%
|
|
South Staffordshire
|
31
|
345
|
9.0%
|
|
Windsor & Maidenhead
|
77
|
841
|
9.1%
|
|
Bolsover
|
63
|
646
|
9.7%
|
|
North East Derbyshire
|
49
|
488
|
10.1%
|
|
Sefton
|
204
|
1918
|
10.6%
|
|
Hyndburn
|
73
|
674
|
10.8%
|
|
Woking
|
38
|
346
|
10.9%
|
|
Chorley
|
54
|
499
|
10.9%
|
|
Waverley
|
69
|
615
|
11.2%
|
|
East Riding of Yorkshire
|
184
|
1585
|
11.6%
|
|
Forest of Dean
|
49
|
424
|
11.7%
|
|
South Oxfordshire
|
58
|
489
|
11.9%
|
|
North Warwickshire
|
30
|
250
|
11.9%
|
|
Derbyshire Dales
|
63
|
475
|
13.4%
|
|
Craven
|
60
|
430
|
13.9%
|
|
Local Authority Average
|
367
|
663
|
55.3%
|
|
Number of households – Rough sleepers and homeless relief duty owed = the number of rough sleepers per area as per Government figures divided into households at a ratio of 2.4 people to a house, then this number of households required is added to the number of households marked as homeless relief and duty owed as per the same Government source to find the total number of houses needed.
|
|||
|
By largest % of vacant dwellings needed
|
|||
|
Location
|
Number of households – Rough sleepers and homeless relief duty owed
|
Long-term vacant dwellings
|
% of vacant homes needed to house homeless
|
|
Crawley
|
414
|
30
|
1378.9%
|
|
Corby
|
132
|
12
|
1097.2%
|
|
Solihull
|
698
|
158
|
441.6%
|
|
Westminster
|
1172
|
304
|
385.4%
|
|
Brent
|
1488
|
405
|
367.3%
|
|
Barking & Dagenham
|
305
|
106
|
287.5%
|
|
Daventry
|
248
|
87
|
285.3%
|
|
Manchester
|
2866
|
1132
|
253.2%
|
|
Thurrock
|
376
|
152
|
247.2%
|
|
Hammersmith & Fulham
|
614
|
278
|
220.9%
|
|
Wandsworth
|
313
|
173
|
181.2%
|
|
North Somerset
|
383
|
216
|
177.1%
|
|
Salford
|
1908
|
1163
|
164.0%
|
|
Tower Hamlets
|
993
|
634
|
156.7%
|
|
Reading
|
585
|
387
|
151.3%
|
|
Bristol
|
1172
|
775
|
151.3%
|
|
Hounslow
|
286
|
191
|
149.5%
|
|
Milton Keynes
|
823
|
578
|
142.4%
|
|
Hackney
|
1283
|
933
|
137.5%
|
|
Mid Devon
|
153
|
113
|
135.6%
|
|
Local Authority Average
|
367
|
663
|
55.3%
|
|
Number of households – Rough sleepers and homeless relief duty owed = the number of rough sleepers per area as per Government figures divided into households at a ratio of 2.4 people to a house, then this number of households required is added to the number of households marked as homeless relief and duty owed as per the same Government source to find the total number of houses needed.
|
|||
You May Also Enjoy

Homebuyers face longer buying timelines
Breaking Property News 1/4/26

What renters and landlords need to know ahead of major rental law changes
Tackling Empty Properties

Pet-friendly rentals plunge 39%