


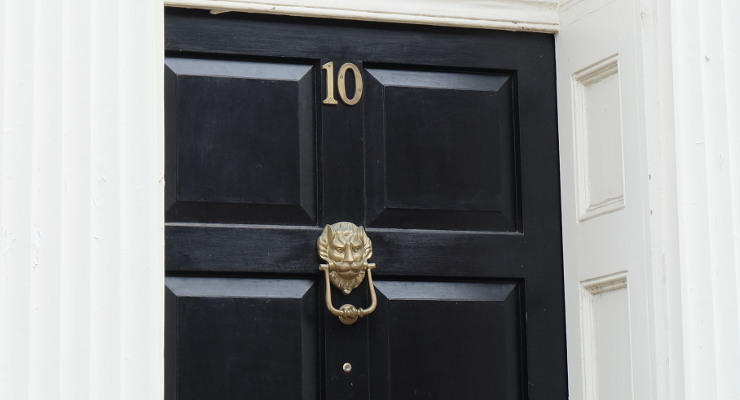
How much for the keys to No.10?
New homes specialists, Stone Real Estate, have looked at the property cost of the Number 10 and where is home to the highest price paid for the number across England and Wales.
Stone Real Estate looked at current market data for the real No.10 Downing Street as well as the average sold price for homes with the number across the nation.
No.10 Downing Street
With an estimated size of 3,800 square feet and based on the current value for each of these square feet in that particular postcode, the bricks and mortar value of No.10 Downing Street is an estimated £5.3m. However, with the real size unknown and the property not only famous but unobtainable for everyone but the PM, the actual value is unknown but likely to be much higher.
Where’s home to the most expensive No.10?
While the value of No.10 Downing Street requires a bit of guestimation, the most expensive No.10 property sold of late was also in London, in Kensington and Chelsea’s Ilchester Place, and it sold for a tidy £12.8m.
The highest average No.10 cost is Bedfordshire
Looking across the nation, Bedfordshire is home to the highest average sold price for property with the No.10, going for £881,445.
Cheshire comes in second with No.10 properties going for an average of £564,250, closely followed by Greater London (£515,000), Surrey (£425,000), Hertfordshire (£408,998), Buckinghamshire (£374,000), Oxfordshire (£366,500), West Sussex (£329,975), Essex (£322,250) and Dorset (£320,000).
In London
The lowest average you’re going to pay is in Barking and Dagenham at £327,050. However, at the other end of the scale, the No.10 averages an impressive £2.3m in Westminster, £1.9m in Kensington and Chelsea, and £1.3m in Camden
County Durham is home to the most affordable average No.10
If you want a more affordable slice of the No.10 action, head to County Durham or South Yorkshire where a property numbered as such will cost you less than £150,000.
Founder and CEO of Stone Real Estate, Michael Stone, commented:
“Who would have thought the average cost of a number ten property could vary by as much as £700,000 across the nation and sell for as much as £12.8m at the top end of the market?
While these are unlikely to be die-hard fans of politics numbers and names can have a big influence on homebuyer decisions, and we’ve highlighted before how the number 13 previously suffered with a lower sold price due to buyer superstitions.
You’d be forgiven for thinking that recent political events may have had the same impact on the number 10 although it seems to be more in demand in some areas than it is in others.”
|
Number 10 Downing Street
|
||||
|
10 Downing St, Westminster, London SW1A 2AA
|
||||
|
Postcode:
|
SW1
|
|||
|
Ave £ per sq ft:
|
£1,405
|
|||
|
Approx size:
|
3,800 Sqft
|
|||
|
Estimated value:
|
£5,339,000
|
|||
|
Price source:
|
||||
|
Size Source:
|
||||
|
Most expensive No.10s sold since 2018
|
||||
|
Town
|
County
|
Postcode
|
Price
|
|
|
ILCHESTER PLACE
|
GREATER LONDON
|
W14 8AA
|
£12,850,000
|
|
|
CHAUCER ROAD
|
CAMBRIDGESHIRE
|
CB2 7EB
|
£5,600,000
|
|
|
NEVILL PARK
|
KENT
|
TN4 8NW
|
£3,775,000
|
|
|
LYNDHURST ROAD
|
DEVON
|
EX2 4PA
|
£2,390,000
|
|
|
SIR HARRYS ROAD
|
WEST MIDLANDS
|
B15 2UY
|
£1,575,000
|
|
|
GRANBY ROAD
|
NORTH YORKSHIRE
|
HG1 4ST
|
£1,550,000
|
|
|
PHEASANT RISE
|
GREATER MANCHESTER
|
WA14 3HL
|
£1,388,000
|
|
|
WESTGATE
|
NOTTINGHAMSHIRE
|
NG25 0JH
|
£1,010,000
|
|
|
STANWELL ROAD
|
WALES
|
CF64 3EA
|
£850,000
|
|
|
HERITAGE GARDENS
|
TYNE AND WEAR
|
NE3 5AF
|
£795,000
|
|
|
Average Sold Price by Area for No.10 Properties
|
||||
|
Location
|
Average Sold Price
|
|||
|
Bedfordshire
|
£881,445
|
|||
|
Cheshire
|
£564,250
|
|||
|
Greater London
|
£515,000
|
|||
|
Surrey
|
£425,000
|
|||
|
Hertfordshire
|
£408,998
|
|||
|
Buckinghamshire
|
£374,000
|
|||
|
Oxfordshire
|
£366,500
|
|||
|
West Sussex
|
£329,975
|
|||
|
Essex
|
£322,250
|
|||
|
Dorset
|
£320,000
|
|||
|
Hampshire
|
£315,000
|
|||
|
Kent
|
£295,000
|
|||
|
Cambridgeshire
|
£292,998
|
|||
|
East Sussex
|
£280,000
|
|||
|
City of Bristol
|
£276,000
|
|||
|
Wiltshire
|
£268,000
|
|||
|
Warwickshire
|
£258,248
|
|||
|
Northamptonshire
|
£249,498
|
|||
|
Gloucestershire
|
£247,000
|
|||
|
Devon
|
£245,000
|
|||
|
Herefordshire
|
£243,000
|
|||
|
Worcestershire
|
£234,000
|
|||
|
Suffolk
|
£230,000
|
|||
|
Rutland
|
£226,498
|
|||
|
Leicestershire
|
£225,000
|
|||
|
Norfolk
|
£224,995
|
|||
|
Isle of Wight
|
£222,500
|
|||
|
Somerset
|
£220,500
|
|||
|
Cornwall
|
£210,000
|
|||
|
Shropshire
|
£210,000
|
|||
|
Staffordshire
|
£209,000
|
|||
|
North Yorkshire
|
£206,000
|
|||
|
East Riding of Yorkshire
|
£182,000
|
|||
|
Nottinghamshire
|
£178,500
|
|||
|
Derbyshire
|
£178,250
|
|||
|
West Midlands
|
£175,000
|
|||
|
Lincolnshire
|
£172,500
|
|||
|
Greater Manchester
|
£170,000
|
|||
|
Lancashire
|
£164,473
|
|||
|
Cumbria
|
£162,000
|
|||
|
Northumberland
|
£160,000
|
|||
|
West Yorkshire
|
£159,950
|
|||
|
Merseyside
|
£155,000
|
|||
|
Tyne and Wear
|
£152,750
|
|||
|
South Yorkshire
|
£145,000
|
|||
|
County Durham
|
£110,000
|
|||
|
Average Sold Price by borough for No.10 Properties
|
||||
|
Borough
|
Median Price (number 10s)
|
|||
|
Westminster
|
£2,330,000
|
|||
|
Kensington and Chelsea
|
£1,962,500
|
|||
|
Camden
|
£1,353,501
|
|||
|
Richmond
|
£782,684
|
|||
|
Wandsworth
|
£781,250
|
|||
|
Hammersmith and Fulham
|
£732,500
|
|||
|
Islington
|
£691,500
|
|||
|
Merton
|
£645,000
|
|||
|
Tower Hamlets
|
£643,000
|
|||
|
Barnet
|
£615,000
|
|||
|
Brent
|
£600,000
|
|||
|
Ealing
|
£549,720
|
|||
|
Haringey
|
£545,000
|
|||
|
Kingston
|
£533,000
|
|||
|
Lambeth
|
£530,000
|
|||
|
Lewisham
|
£515,000
|
|||
|
Hackney
|
£500,000
|
|||
|
Croydon
|
£490,000
|
|||
|
Southwark
|
£482,000
|
|||
|
Bromley
|
£480,000
|
|||
|
Redbridge
|
£480,000
|
|||
|
Waltham Forest
|
£467,750
|
|||
|
Enfield
|
£465,000
|
|||
|
Harrow
|
£460,000
|
|||
|
Hillingdon
|
£455,500
|
|||
|
Greenwich
|
£427,500
|
|||
|
Sutton
|
£422,250
|
|||
|
City of London
|
£390,000
|
|||
|
Newham
|
£386,000
|
|||
|
Hounslow
|
£384,750
|
|||
|
Havering
|
£376,500
|
|||
|
Bexley
|
£335,000
|
|||
|
Barking and Dagenham
|
£327,050
|
|||
You May Also Enjoy
What to know when buying land
Tenant demand strong, landlord supply shrinking

Why Join a Letting Agents Association?

House price growth remained subdued in July
