


New build homes, Mars Bars, crisps, cars and coffee – which offers the best value per kg
The latest research by new homes specialists, Stone Real Estate, has looked at the average cost of a new build based on the price per brick and what this translates to per kg, how this compares to some day to day and more high end products on a per kg basis, and where is home to the most expensive bricks in the UK.
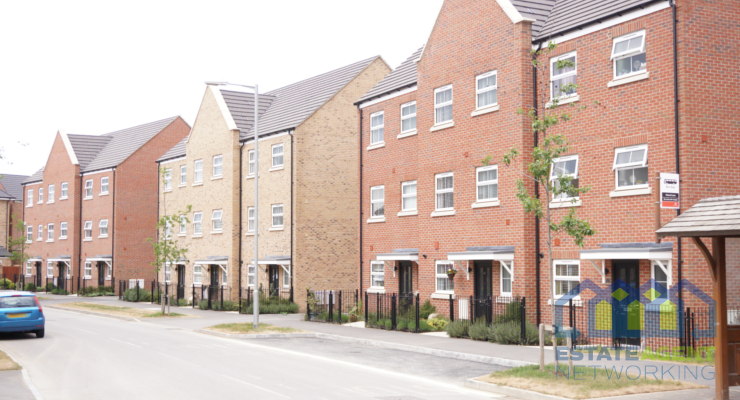
The research shows that with the average new build costing £293,167 across the UK and consisting of 5,180 bricks on average, the cost of a brick on a new property is £57. With the average brick weighing 2.7kg, that’s a cost of £21 per kilogram.
While new builds often come with a price premium, they represent great value for UK buyers due to the better condition of the property, the buyer incentives that can sometimes be offered i.e. stamp duty etc. and the wealth of additional amenities that often come with today’s new developments.
When you consider the cost of a brick per kg and how this compares to other day to day purchases, the value is even clearer.
While a new build bricks ranks top when compared to day to day items for cost, Walkers crisps come in pretty close, costing £18 per kg. A medium sized car will set you back £14 per kg today, while coffee and a Big Mac are priced at £13 per kg in today’s climate.
Mars Bars are currently valued at £12 per kg, with sausages coming in at £5.
When it comes to the more extravagant purchases in the world today, the value of a new build is even more evident, with Kobe beef costing £200 per kg, truffles costing £1,688 per kg and an iPhone 11 hitting £3,878 per kg.
When looking at the straight up cost of a single brick, the cost does, of course, differ across the UK.
In Kensington and Chelsea, the cost of a new build brick hits £214, followed by £198 in Westminster and £174 in the City of London. Outside of London, it will set you back £150 in South Bucks, however, in Chiltern, the average new build brick is currently valued at just £19!
Burnley (£23), North and East Ayrshire (£23 & £29) and Inverclyde (£29) are also home to some of the best value new build brick costs in the UK, while Bexley is home to the best value brick in the capital at £64.
Founder and CEO of Stone Real Estate, Michael Stone, commented:
“The new build sector offers far better value for money when compared to existing housing stock and new build homes also hold their value for much longer.
While the initial price point may be higher, the average cost of a new build brick doesn’t come in that much more than other day to day items such as crisps, chocolate or coffee when you compare them on a per kilogram basis.
The additional benefit is that you also get a house within those bricks and something that lasts far longer than a kilogram of Mars Bars while also providing a return at the end of it, with the latter offering not much more than a stomach ache.
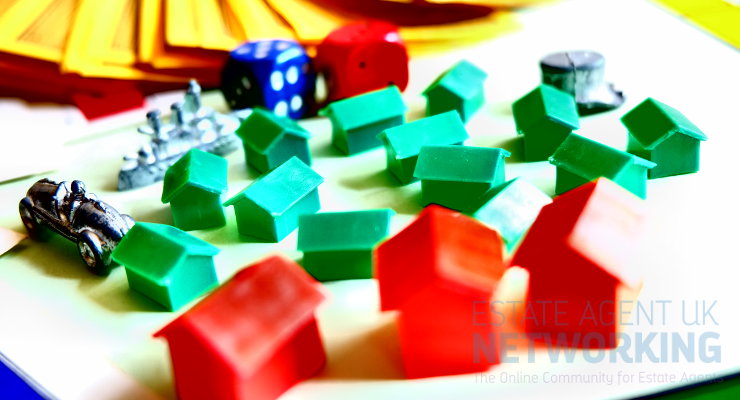
Of course, it isn’t as simple as getting on the ladder one brick at a time but for those that can knuckle down and save, getting that foot on the ladder is still one of the soundest investments you can make, despite the recent years of consistent house price growth.”
|
Location
|
Price per brick*
|
Price per kg
|
||
|
United Kingdom
|
£293,167
|
£57
|
2.7
|
£21
|
|
England
|
£313,823
|
£61
|
2.7
|
£22
|
|
Wales
|
£220,532
|
£43
|
2.7
|
£16
|
|
Scotland
|
£215,105
|
£42
|
2.7
|
£15
|
|
Northern Ireland
|
£166,287
|
£32
|
2.7
|
£12
|
|
Great Britain
|
£303,975
|
£59
|
2.7
|
£22
|
|
Comparison items – price per kg
|
|||
|
Item
|
Weight
|
Average price
|
Average price per kg
|
|
1g
|
£38.91
|
£38,910
|
|
|
Rolex Submariner watch
|
155g
|
£37,065
|
|
|
1g
|
£30.00
|
£30,000
|
|
|
188g
|
£3,878
|
||
|
1kg
|
£1,783
|
£1,688
|
|
|
1g
|
£0.45
|
£450
|
|
|
1kg
|
£445.00
|
£445
|
|
|
1kg
|
£200.00
|
£200
|
|
|
Brick
|
2.7
|
£56.60
|
£21
|
|
32.5g
|
£0.60
|
£18
|
|
|
£22,495
|
£14
|
||
|
227g
|
£3.05
|
£13
|
|
|
240g
|
£3.09
|
£13
|
|
|
51g
|
£0.60
|
£12
|
|
|
£13,985
|
£12
|
||
|
1kg
|
£5.00
|
£5
|
|
|
Cost per new build brick by region and nation
|
||
|
Location
|
AveNB price
|
Price of each brick
|
|
London
|
£502,228
|
£97
|
|
South East
|
£386,190
|
£75
|
|
East of England
|
£370,487
|
£72
|
|
South West
|
£310,226
|
£60
|
|
West Midlands Region
|
£276,050
|
£53
|
|
East Midlands
|
£268,420
|
£52
|
|
North West
|
£226,279
|
£44
|
|
Yorkshire and The Humber
|
£212,721
|
£41
|
|
North East
|
£193,956
|
£37
|
|
England
|
£313,823
|
£61
|
|
Wales
|
£220,532
|
£43
|
|
Scotland
|
£215,105
|
£42
|
|
Great Britain
|
£303,975
|
£59
|
|
United Kingdom
|
£293,167
|
£57
|
|
Most expensive price per new build brick
|
||
|
Location
|
AveNB price
|
Price of each brick
|
|
Kensington And Chelsea
|
£1,110,335
|
£214
|
|
City of Westminster
|
£1,024,956
|
£198
|
|
City of London
|
£901,226
|
£174
|
|
Camden
|
£829,137
|
£160
|
|
South Bucks
|
£774,701
|
£150
|
|
Elmbridge
|
£730,493
|
£141
|
|
Hammersmith and Fulham
|
£685,985
|
£132
|
|
Chiltern
|
£648,062
|
£125
|
|
Rochford
|
£637,023
|
£123
|
|
Three Rivers
|
£625,232
|
£121
|
|
Hackney
|
£618,290
|
£119
|
|
Islington
|
£615,025
|
£119
|
|
Mole Valley
|
£612,122
|
£118
|
|
Wandsworth
|
£611,694
|
£118
|
|
Merton
|
£609,973
|
£118
|
|
Most expensive price per new build brick Exc London
|
||
|
Location
|
AveNB price
|
Price of each brick
|
|
South Bucks
|
£774,701
|
£150
|
|
Elmbridge
|
£730,493
|
£141
|
|
Chiltern
|
£648,062
|
£125
|
|
Rochford
|
£637,023
|
£123
|
|
Three Rivers
|
£625,232
|
£121
|
|
Mole Valley
|
£612,122
|
£118
|
|
Cambridge
|
£603,968
|
£117
|
|
Reigate and Banstead
|
£590,719
|
£114
|
|
Guildford
|
£581,948
|
£112
|
|
Cotswold
|
£574,057
|
£111
|
|
Epping Forest
|
£570,772
|
£110
|
|
Harlow
|
£564,739
|
£109
|
|
Broxbourne
|
£553,169
|
£107
|
|
Gravesham
|
£537,971
|
£104
|
|
Winchester
|
£522,313
|
£101
|
|
Least expensive price per new build brick
|
||
|
Location
|
AveNB price
|
Price of each brick
|
|
Hyndburn
|
£99,793
|
£19
|
|
Burnley
|
£117,247
|
£23
|
|
North Ayrshire
|
£121,553
|
£23
|
|
East Ayrshire
|
£148,606
|
£29
|
|
Inverclyde
|
£150,664
|
£29
|
|
Blackpool
|
£151,182
|
£29
|
|
Hartlepool
|
£151,583
|
£29
|
|
Stockton-on-Tees
|
£154,032
|
£30
|
|
County Durham
|
£154,690
|
£30
|
|
Pendle
|
£158,426
|
£31
|
|
Argyll and Bute
|
£158,681
|
£31
|
|
Barnsley
|
£159,235
|
£31
|
|
Doncaster
|
£161,866
|
£31
|
|
North Lanarkshire
|
£161,907
|
£31
|
|
City of Dundee
|
£162,178
|
£31
|
|
Price per new build brick by London borough
|
||
|
Location
|
AveNB price
|
Price of each brick
|
|
Barking and Dagenham
|
£396,916
|
£77
|
|
Barnet
|
£545,582
|
£105
|
|
Bexley
|
£329,456
|
£64
|
|
Brent
|
£488,987
|
£94
|
|
Bromley
|
£468,181
|
£90
|
|
Camden
|
£829,137
|
£160
|
|
City of London
|
£901,226
|
£174
|
|
City of Westminster
|
£1,024,956
|
£198
|
|
Croydon
|
£356,414
|
£69
|
|
Ealing
|
£481,181
|
£93
|
|
Enfield
|
£376,247
|
£73
|
|
Greenwich
|
£421,220
|
£81
|
|
Hackney
|
£618,290
|
£119
|
|
Hammersmith and Fulham
|
£685,985
|
£132
|
|
Haringey
|
£519,509
|
£100
|
|
Harrow
|
£413,828
|
£80
|
|
Havering
|
£408,097
|
£79
|
|
Hillingdon
|
£443,808
|
£86
|
|
Hounslow
|
£381,989
|
£74
|
|
Islington
|
£615,025
|
£119
|
|
Kensington And Chelsea
|
£1,110,335
|
£214
|
|
Kingston upon Thames
|
£550,997
|
£106
|
|
Lambeth
|
£560,343
|
£108
|
|
Lewisham
|
£420,633
|
£81
|
|
Merton
|
£609,973
|
£118
|
|
Newham
|
£487,727
|
£94
|
|
Redbridge
|
£557,647
|
£108
|
|
Richmond upon Thames
|
£552,529
|
£107
|
|
Southwark
|
£517,227
|
£100
|
|
Sutton
|
£405,532
|
£78
|
|
Tower Hamlets
|
£459,273
|
£89
|
|
Waltham Forest
|
£477,226
|
£92
|
|
Wandsworth
|
£611,694
|
£118
|
You May Also Enjoy

Dispelling the top five biggest letting agent myths

Bank of England Holds Interest Rates at 3.75%

Average new-build value to surpass £400,000
Money and Credit – June 2026
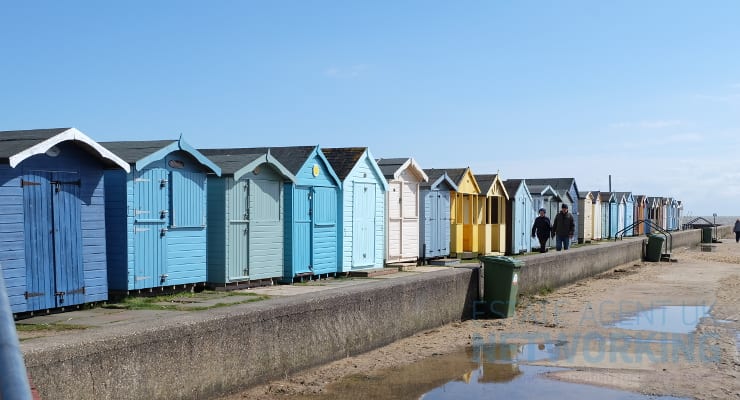
Price of a sea-view home up 27% since 2019
