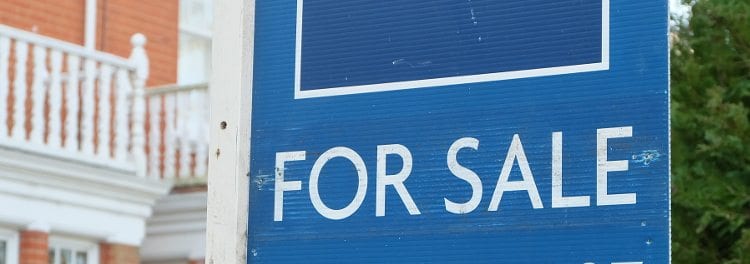
The 61% of Britain that is still affordable for Generation Rent

The latest research by lettings management platform, Howsy, has revealed that 61% of Britain still remains within the boundaries of affordability for the nation’s younger renters.
Howsy looked at the cost of renting across each local authority of England, Scotland and Wales coupled with the average salary for 22-29-year-olds in that region. Howsy then looked at what percentage of income is swallowed up by financial rental requirements and where remains the most realistic for renters.
The research shows that across Britain the average rent of £843 per month accounts for 51% of the average salary of £1,639. However, there are a total of five areas where rent accounts for over 100% of the average salary, four of which are located in London.
But the difference between 99% of salary spent on renting and 100% doesn’t make an area affordable for tenants and in fact, affordability starts to become an issue once the cost of rent exceeds 50% of your salary.
With this in mind, Howsy then looked at where across the nation the average monthly rent accounted for 50% or less of earnings and found that on this basis, 61% of areas were still home to an affordable rental market for the younger generation.
The best of the bunch is Rhondda Cynon Taf in Wales, with just 28% of income required to cover rental costs, along with Blaenau Gwent.
At 30%, Burnley is the most affordable market for young renters in England and the North West, while in Scotland, Dumfries and Galloway is the most affordable and ranks eight overall at 31%.
Barnsley also makes the top 10 and is the most affordable in the Yorkshire and the Humber region at 32%, along with Bolsover which ranks as the best option in the East Midlands.
South Tyneside is top in the North East (33%), while Waveney is the most affordable in the East of England (34%), with Staffordshire Moorlands the most affordable in the West Midlands (35%).
Folkestone and Hythe is the South East’s most affordable rental market, with Torridge in the South West still just about affordable at 40%. Predictably, the cheapest area in London falls outside of the 50% affordability threshold, with Bexley coming in at 52%.
Founder and CEO of Howsy, Calum Brannan, commented:
“A lack of wage growth to keep pace with the increasing cost of renting is resulting in more of the nation’s tenants paying above the fifty percent affordability threshold when it comes to the proportion of salary spent on rent.
However, despite the government’s attempts to dampen the financial return of buy-to-let landlords through a number of financial penalties including a ban on tenant fees, an increase in stamp duty and a reduction in buy-to-let tax incentives, we haven’t seen the knee-jerk spike in rents that many predicted.
We believe it is important to be innovative with solutions to ensure that the rental market is open to as many people as possible. Products such as Howsy Club turn the tradition of the high up-front deposit on its head, wiping out a high cost that, along with monthly rent, can be a big barrier many tenants getting their foot on the rental ladder.
Of course, affordability is always going to be a problem in some areas, but a vast majority of areas in Britain still remain realistic as rental locations for the nation’s youngest tenants.”
|
Rent to income ratio in the most affordable rental locations in each region of Britain
|
||||
|
Location
|
Region
|
Monthly NET pay (age group 22-29)
|
Average monthly rent (2019)
|
Overall – Rent as proportion of net salary
|
|
Rhondda Cynon Taf
|
WALES
|
£1,478
|
£419
|
28%
|
|
Burnley
|
NORTH WEST
|
£1,560
|
£462
|
30%
|
|
Dumfries and Galloway
|
SCOTLAND
|
£1,584
|
£490
|
31%
|
|
Barnsley
|
YORKSHIRE AND THE HUMBER
|
£1,531
|
£494
|
32%
|
|
Bolsover
|
EAST MIDLANDS
|
£1,562
|
£494
|
32%
|
|
South Tyneside
|
NORTH EAST
|
£1,503
|
£498
|
33%
|
|
Waveney
|
EAST OF ENGLAND
|
£1,637
|
£557
|
34%
|
|
Staffordshire Moorlands
|
WEST MIDLANDS
|
£1,546
|
£536
|
35%
|
|
Folkestone and Hythe
|
SOUTH EAST
|
£1,665
|
£645
|
39%
|
|
Torridge
|
SOUTH WEST
|
£1,548
|
£612
|
40%
|
|
Bexley
|
LONDON
|
£2,137
|
£1,106
|
52%
|
|
Rent to income ratio in the all locations in Britain
|
||||
|
Location
|
Region
|
Monthly NET pay (age group 22-29)
|
Average monthly rent (2019)
|
Overall – Rent as proportion of net salary
|
|
Rhondda Cynon Taf
|
WALES
|
£1,478
|
£419
|
28%
|
|
Blaenau Gwent
|
WALES
|
£1,478
|
£411
|
28%
|
|
Burnley
|
NORTH WEST
|
£1,560
|
£462
|
30%
|
|
Powys
|
WALES
|
£1,478
|
£462
|
31%
|
|
Carlisle
|
NORTH WEST
|
£1,560
|
£487
|
31%
|
|
Pendle
|
NORTH WEST
|
£1,560
|
£483
|
31%
|
|
Carmarthenshire
|
WALES
|
£1,478
|
£458
|
31%
|
|
Dumfries and Galloway
|
SCOTLAND
|
£1,584
|
£490
|
31%
|
|
Hyndburn
|
NORTH WEST
|
£1,560
|
£476
|
31%
|
|
Barnsley
|
YORKSHIRE AND THE HUMBER
|
£1,531
|
£494
|
32%
|
|
Merthyr Tydfil
|
WALES
|
£1,478
|
£472
|
32%
|
|
Pembrokeshire
|
WALES
|
£1,478
|
£471
|
32%
|
|
Neath Port Talbot
|
WALES
|
£1,478
|
£469
|
32%
|
|
Bolsover
|
EAST MIDLANDS
|
£1,562
|
£494
|
32%
|
|
North Lanarkshire
|
SCOTLAND
|
£1,584
|
£528
|
33%
|
|
East Ayrshire
|
SCOTLAND
|
£1,584
|
£528
|
33%
|
|
North Ayrshire
|
SCOTLAND
|
£1,584
|
£528
|
33%
|
|
South Ayrshire
|
SCOTLAND
|
£1,584
|
£528
|
33%
|
|
Rotherham
|
YORKSHIRE AND THE HUMBER
|
£1,531
|
£510
|
33%
|
|
Isle of Anglesey
|
WALES
|
£1,478
|
£490
|
33%
|
|
Allerdale
|
NORTH WEST
|
£1,560
|
£517
|
33%
|
|
South Tyneside
|
NORTH EAST
|
£1,503
|
£498
|
33%
|
|
Mansfield
|
EAST MIDLANDS
|
£1,562
|
£516
|
33%
|
|
Gwynedd
|
WALES
|
£1,478
|
£488
|
33%
|
|
Wigan
|
NORTH WEST
|
£1,560
|
£514
|
33%
|
|
Torfaen
|
WALES
|
£1,478
|
£486
|
33%
|
|
Doncaster
|
YORKSHIRE AND THE HUMBER
|
£1,531
|
£503
|
33%
|
|
East Lindsey
|
EAST MIDLANDS
|
£1,562
|
£513
|
33%
|
|
Copeland
|
NORTH WEST
|
£1,560
|
£511
|
33%
|
|
Sunderland
|
NORTH EAST
|
£1,503
|
£517
|
34%
|
|
Rossendale
|
NORTH WEST
|
£1,560
|
£536
|
34%
|
|
Ceredigion
|
WALES
|
£1,478
|
£507
|
34%
|
|
Liverpool
|
NORTH WEST
|
£1,560
|
£532
|
34%
|
|
St. Helens
|
NORTH WEST
|
£1,560
|
£531
|
34%
|
|
Waveney
|
EAST OF ENGLAND
|
£1,637
|
£557
|
34%
|
|
Barrow-in-Furness
|
NORTH WEST
|
£1,560
|
£530
|
34%
|
|
Scarborough
|
YORKSHIRE AND THE HUMBER
|
£1,531
|
£517
|
34%
|
|
Calderdale
|
YORKSHIRE AND THE HUMBER
|
£1,531
|
£517
|
34%
|
|
Rochdale
|
NORTH WEST
|
£1,560
|
£526
|
34%
|
|
Caerphilly
|
WALES
|
£1,478
|
£498
|
34%
|
|
Ashfield
|
EAST MIDLANDS
|
£1,562
|
£525
|
34%
|
|
Gateshead
|
NORTH EAST
|
£1,503
|
£531
|
35%
|
|
Bassetlaw
|
EAST MIDLANDS
|
£1,562
|
£551
|
35%
|
|
West Lindsey
|
EAST MIDLANDS
|
£1,562
|
£550
|
35%
|
|
Denbighshire
|
WALES
|
£1,478
|
£518
|
35%
|
|
Scottish Borders
|
SCOTLAND
|
£1,584
|
£552
|
35%
|
|
Chesterfield
|
EAST MIDLANDS
|
£1,562
|
£543
|
35%
|
|
Bridgend
|
WALES
|
£1,478
|
£513
|
35%
|
|
Staffordshire Moorlands
|
WEST MIDLANDS
|
£1,546
|
£536
|
35%
|
|
Great Yarmouth
|
EAST OF ENGLAND
|
£1,637
|
£566
|
35%
|
|
High Peak
|
EAST MIDLANDS
|
£1,562
|
£570
|
36%
|
|
Newport
|
WALES
|
£1,478
|
£539
|
36%
|
|
Newark and Sherwood
|
EAST MIDLANDS
|
£1,562
|
£569
|
36%
|
|
Wrexham
|
WALES
|
£1,478
|
£537
|
36%
|
|
Cannock Chase
|
WEST MIDLANDS
|
£1,546
|
£559
|
36%
|
|
Preston
|
NORTH WEST
|
£1,560
|
£564
|
36%
|
|
Wakefield
|
YORKSHIRE AND THE HUMBER
|
£1,531
|
£548
|
36%
|
|
Tameside
|
NORTH WEST
|
£1,560
|
£558
|
36%
|
|
Kirklees
|
YORKSHIRE AND THE HUMBER
|
£1,531
|
£546
|
36%
|
|
Charnwood
|
EAST MIDLANDS
|
£1,562
|
£556
|
36%
|
|
Argyll and Bute
|
SCOTLAND
|
£1,584
|
£594
|
37%
|
|
Swansea
|
WALES
|
£1,478
|
£552
|
37%
|
|
Lincoln
|
EAST MIDLANDS
|
£1,562
|
£581
|
37%
|
|
Wolverhampton
|
WEST MIDLANDS
|
£1,546
|
£573
|
37%
|
|
West Lancashire
|
NORTH WEST
|
£1,560
|
£578
|
37%
|
|
Bolton
|
NORTH WEST
|
£1,560
|
£578
|
37%
|
|
Dudley
|
WEST MIDLANDS
|
£1,546
|
£572
|
37%
|
|
Walsall
|
WEST MIDLANDS
|
£1,546
|
£572
|
37%
|
|
Wyre
|
NORTH WEST
|
£1,560
|
£577
|
37%
|
|
Lancaster
|
NORTH WEST
|
£1,560
|
£576
|
37%
|
|
Wirral
|
NORTH WEST
|
£1,560
|
£576
|
37%
|
|
Oldham
|
NORTH WEST
|
£1,560
|
£573
|
37%
|
|
Knowsley
|
NORTH WEST
|
£1,560
|
£572
|
37%
|
|
Eden
|
NORTH WEST
|
£1,560
|
£570
|
37%
|
|
Sefton
|
NORTH WEST
|
£1,560
|
£570
|
37%
|
|
Bradford
|
YORKSHIRE AND THE HUMBER
|
£1,531
|
£559
|
37%
|
|
Richmondshire
|
YORKSHIRE AND THE HUMBER
|
£1,531
|
£587
|
38%
|
|
South Ribble
|
NORTH WEST
|
£1,560
|
£598
|
38%
|
|
Sandwell
|
WEST MIDLANDS
|
£1,546
|
£589
|
38%
|
|
Fenland
|
EAST OF ENGLAND
|
£1,637
|
£623
|
38%
|
|
North Tyneside
|
NORTH EAST
|
£1,503
|
£571
|
38%
|
|
Nuneaton and Bedworth
|
WEST MIDLANDS
|
£1,546
|
£587
|
38%
|
|
Chorley
|
NORTH WEST
|
£1,560
|
£592
|
38%
|
|
Amber Valley
|
EAST MIDLANDS
|
£1,562
|
£591
|
38%
|
|
Corby
|
EAST MIDLANDS
|
£1,562
|
£591
|
38%
|
|
Erewash
|
EAST MIDLANDS
|
£1,562
|
£588
|
38%
|
|
Flintshire
|
WALES
|
£1,478
|
£582
|
39%
|
|
Perth and Kinross
|
SCOTLAND
|
£1,584
|
£624
|
39%
|
|
East Renfrewshire
|
SCOTLAND
|
£1,584
|
£623
|
39%
|
|
Inverclyde
|
SCOTLAND
|
£1,584
|
£623
|
39%
|
|
Renfrewshire
|
SCOTLAND
|
£1,584
|
£623
|
39%
|
|
Highland
|
SCOTLAND
|
£1,584
|
£618
|
39%
|
|
Na h-Eileanan Siar
|
SCOTLAND
|
£1,584
|
£618
|
39%
|
|
Orkney Islands
|
SCOTLAND
|
£1,584
|
£618
|
39%
|
|
Shetland Islands
|
SCOTLAND
|
£1,584
|
£618
|
39%
|
|
Folkestone and Hythe
|
SOUTH EAST
|
£1,665
|
£645
|
39%
|
|
Wyre Forest
|
WEST MIDLANDS
|
£1,546
|
£598
|
39%
|
|
Fylde
|
NORTH WEST
|
£1,560
|
£601
|
39%
|
|
Boston
|
EAST MIDLANDS
|
£1,562
|
£602
|
39%
|
|
North East Derbyshire
|
EAST MIDLANDS
|
£1,562
|
£602
|
39%
|
|
North Norfolk
|
EAST OF ENGLAND
|
£1,637
|
£663
|
40%
|
|
Ipswich
|
EAST OF ENGLAND
|
£1,637
|
£663
|
40%
|
|
Selby
|
YORKSHIRE AND THE HUMBER
|
£1,531
|
£619
|
40%
|
|
Stafford
|
WEST MIDLANDS
|
£1,546
|
£625
|
40%
|
|
Bury
|
NORTH WEST
|
£1,560
|
£627
|
40%
|
|
West Dunbartonshire
|
SCOTLAND
|
£1,584
|
£630
|
40%
|
|
Fife
|
SCOTLAND
|
£1,584
|
£629
|
40%
|
|
Conwy
|
WALES
|
£1,478
|
£587
|
40%
|
|
South Lanarkshire
|
SCOTLAND
|
£1,584
|
£628
|
40%
|
|
East Staffordshire
|
WEST MIDLANDS
|
£1,546
|
£612
|
40%
|
|
Hastings
|
SOUTH EAST
|
£1,665
|
£659
|
40%
|
|
South Holland
|
EAST MIDLANDS
|
£1,562
|
£618
|
40%
|
|
Craven
|
YORKSHIRE AND THE HUMBER
|
£1,531
|
£605
|
40%
|
|
Torridge
|
SOUTH WEST
|
£1,548
|
£612
|
40%
|
|
Hambleton
|
YORKSHIRE AND THE HUMBER
|
£1,531
|
£635
|
41%
|
|
Hinckley and Bosworth
|
EAST MIDLANDS
|
£1,562
|
£648
|
41%
|
|
Melton
|
EAST MIDLANDS
|
£1,562
|
£645
|
41%
|
|
Forest of Dean
|
SOUTH WEST
|
£1,548
|
£639
|
41%
|
|
King’s Lynn and West Norfolk
|
EAST OF ENGLAND
|
£1,637
|
£675
|
41%
|
|
North Devon
|
SOUTH WEST
|
£1,548
|
£637
|
41%
|
|
Sheffield
|
YORKSHIRE AND THE HUMBER
|
£1,531
|
£629
|
41%
|
|
Dover
|
SOUTH EAST
|
£1,665
|
£680
|
41%
|
|
North Kesteven
|
EAST MIDLANDS
|
£1,562
|
£637
|
41%
|
|
Broxtowe
|
EAST MIDLANDS
|
£1,562
|
£636
|
41%
|
|
Thanet
|
SOUTH EAST
|
£1,665
|
£701
|
42%
|
|
Ryedale
|
YORKSHIRE AND THE HUMBER
|
£1,531
|
£641
|
42%
|
|
Gedling
|
EAST MIDLANDS
|
£1,562
|
£651
|
42%
|
|
Angus
|
SCOTLAND
|
£1,584
|
£660
|
42%
|
|
Dundee City
|
SCOTLAND
|
£1,584
|
£660
|
42%
|
|
West Lothian
|
SCOTLAND
|
£1,584
|
£659
|
42%
|
|
Newcastle-under-Lyme
|
WEST MIDLANDS
|
£1,546
|
£670
|
43%
|
|
Monmouthshire
|
WALES
|
£1,478
|
£641
|
43%
|
|
Tamworth
|
WEST MIDLANDS
|
£1,546
|
£669
|
43%
|
|
South Derbyshire
|
EAST MIDLANDS
|
£1,562
|
£675
|
43%
|
|
Weymouth and Portland
|
SOUTH WEST
|
£1,548
|
£666
|
43%
|
|
South Somerset
|
SOUTH WEST
|
£1,548
|
£666
|
43%
|
|
West Somerset
|
SOUTH WEST
|
£1,548
|
£666
|
43%
|
|
South Kesteven
|
EAST MIDLANDS
|
£1,562
|
£671
|
43%
|
|
Clackmannanshire
|
SCOTLAND
|
£1,584
|
£677
|
43%
|
|
Falkirk
|
SCOTLAND
|
£1,584
|
£677
|
43%
|
|
Stirling
|
SCOTLAND
|
£1,584
|
£677
|
43%
|
|
Vale of Glamorgan
|
WALES
|
£1,478
|
£631
|
43%
|
|
Kettering
|
EAST MIDLANDS
|
£1,562
|
£667
|
43%
|
|
Worcester
|
WEST MIDLANDS
|
£1,546
|
£658
|
43%
|
|
Breckland
|
EAST OF ENGLAND
|
£1,637
|
£697
|
43%
|
|
Gloucester
|
SOUTH WEST
|
£1,548
|
£659
|
43%
|
|
Coventry
|
WEST MIDLANDS
|
£1,546
|
£657
|
43%
|
|
Wellingborough
|
EAST MIDLANDS
|
£1,562
|
£695
|
44%
|
|
North West Leicestershire
|
EAST MIDLANDS
|
£1,562
|
£694
|
44%
|
|
Taunton Deane
|
SOUTH WEST
|
£1,548
|
£686
|
44%
|
|
Mid Devon
|
SOUTH WEST
|
£1,548
|
£683
|
44%
|
|
North Warwickshire
|
WEST MIDLANDS
|
£1,546
|
£681
|
44%
|
|
South Lakeland
|
NORTH WEST
|
£1,560
|
£687
|
44%
|
|
Sedgemoor
|
SOUTH WEST
|
£1,548
|
£681
|
44%
|
|
Ribble Valley
|
NORTH WEST
|
£1,560
|
£684
|
44%
|
|
West Devon
|
SOUTH WEST
|
£1,548
|
£679
|
44%
|
|
Suffolk Coastal
|
EAST OF ENGLAND
|
£1,637
|
£713
|
44%
|
|
Redditch
|
WEST MIDLANDS
|
£1,546
|
£673
|
44%
|
|
Babergh
|
EAST OF ENGLAND
|
£1,637
|
£742
|
45%
|
|
Derbyshire Dales
|
EAST MIDLANDS
|
£1,562
|
£703
|
45%
|
|
Tendring
|
EAST OF ENGLAND
|
£1,637
|
£736
|
45%
|
|
Mid Suffolk
|
EAST OF ENGLAND
|
£1,637
|
£736
|
45%
|
|
Newcastle upon Tyne
|
NORTH EAST
|
£1,503
|
£674
|
45%
|
|
Broadland
|
EAST OF ENGLAND
|
£1,637
|
£760
|
46%
|
|
Aberdeen City
|
SCOTLAND
|
£1,584
|
£735
|
46%
|
|
Aberdeenshire
|
SCOTLAND
|
£1,584
|
£735
|
46%
|
|
Moray
|
SCOTLAND
|
£1,584
|
£735
|
46%
|
|
Rushcliffe
|
EAST MIDLANDS
|
£1,562
|
£721
|
46%
|
|
Stroud
|
SOUTH WEST
|
£1,548
|
£714
|
46%
|
|
Blaby
|
EAST MIDLANDS
|
£1,562
|
£720
|
46%
|
|
Malvern Hills
|
WEST MIDLANDS
|
£1,546
|
£709
|
46%
|
|
Teignbridge
|
SOUTH WEST
|
£1,548
|
£708
|
46%
|
|
South Norfolk
|
EAST OF ENGLAND
|
£1,637
|
£747
|
46%
|
|
Gosport
|
SOUTH EAST
|
£1,665
|
£759
|
46%
|
|
Northampton
|
EAST MIDLANDS
|
£1,562
|
£712
|
46%
|
|
Bromsgrove
|
WEST MIDLANDS
|
£1,546
|
£734
|
47%
|
|
Stockport
|
NORTH WEST
|
£1,560
|
£739
|
47%
|
|
Salford
|
NORTH WEST
|
£1,560
|
£735
|
47%
|
|
Oadby and Wigston
|
EAST MIDLANDS
|
£1,562
|
£735
|
47%
|
|
South Staffordshire
|
WEST MIDLANDS
|
£1,546
|
£727
|
47%
|
|
Birmingham
|
WEST MIDLANDS
|
£1,546
|
£724
|
47%
|
|
Rugby
|
WEST MIDLANDS
|
£1,546
|
£724
|
47%
|
|
Lichfield
|
WEST MIDLANDS
|
£1,546
|
£749
|
48%
|
|
Eastbourne
|
SOUTH EAST
|
£1,665
|
£793
|
48%
|
|
Tewkesbury
|
SOUTH WEST
|
£1,548
|
£766
|
49%
|
|
Ashford
|
SOUTH EAST
|
£1,665
|
£821
|
49%
|
|
Norwich
|
EAST OF ENGLAND
|
£1,637
|
£805
|
49%
|
|
Mendip
|
SOUTH WEST
|
£1,548
|
£760
|
49%
|
|
Swale
|
SOUTH EAST
|
£1,665
|
£816
|
49%
|
|
Harborough
|
EAST MIDLANDS
|
£1,562
|
£765
|
49%
|
|
Wychavon
|
WEST MIDLANDS
|
£1,546
|
£755
|
49%
|
|
East Devon
|
SOUTH WEST
|
£1,548
|
£753
|
49%
|
|
Huntingdonshire
|
EAST OF ENGLAND
|
£1,637
|
£826
|
50%
|
|
Rother
|
SOUTH EAST
|
£1,665
|
£835
|
50%
|
|
South Hams
|
SOUTH WEST
|
£1,548
|
£776
|
50%
|
|
Worthing
|
SOUTH EAST
|
£1,665
|
£832
|
50%
|
|
North Dorset
|
SOUTH WEST
|
£1,548
|
£771
|
50%
|
|
Cardiff
|
WALES
|
£1,478
|
£733
|
50%
|
|
East Dunbartonshire
|
SCOTLAND
|
£1,584
|
£811
|
51%
|
|
Daventry
|
EAST MIDLANDS
|
£1,562
|
£797
|
51%
|
|
Arun
|
SOUTH EAST
|
£1,665
|
£847
|
51%
|
|
Colchester
|
EAST OF ENGLAND
|
£1,637
|
£829
|
51%
|
|
Braintree
|
EAST OF ENGLAND
|
£1,637
|
£828
|
51%
|
|
Leeds
|
YORKSHIRE AND THE HUMBER
|
£1,531
|
£774
|
51%
|
|
East Northamptonshire
|
EAST MIDLANDS
|
£1,562
|
£790
|
51%
|
|
Cheltenham
|
SOUTH WEST
|
£1,548
|
£811
|
52%
|
|
Maidstone
|
SOUTH EAST
|
£1,665
|
£871
|
52%
|
|
Eastleigh
|
SOUTH EAST
|
£1,665
|
£870
|
52%
|
|
St Edmundsbury
|
EAST OF ENGLAND
|
£1,637
|
£854
|
52%
|
|
Rushmoor
|
SOUTH EAST
|
£1,665
|
£866
|
52%
|
|
Havant
|
SOUTH EAST
|
£1,665
|
£865
|
52%
|
|
Bexley
|
LONDON
|
£2,137
|
£1,106
|
52%
|
|
West Dorset
|
SOUTH WEST
|
£1,548
|
£826
|
53%
|
|
Purbeck
|
SOUTH WEST
|
£1,548
|
£825
|
53%
|
|
Croydon
|
LONDON
|
£2,137
|
£1,136
|
53%
|
|
Manchester
|
NORTH WEST
|
£1,560
|
£822
|
53%
|
|
Canterbury
|
SOUTH EAST
|
£1,665
|
£876
|
53%
|
|
Gravesham
|
SOUTH EAST
|
£1,665
|
£902
|
54%
|
|
Warwick
|
WEST MIDLANDS
|
£1,546
|
£830
|
54%
|
|
East Cambridgeshire
|
EAST OF ENGLAND
|
£1,637
|
£899
|
55%
|
|
Fareham
|
SOUTH EAST
|
£1,665
|
£914
|
55%
|
|
Stevenage
|
EAST OF ENGLAND
|
£1,637
|
£898
|
55%
|
|
Maldon
|
EAST OF ENGLAND
|
£1,637
|
£897
|
55%
|
|
Havering
|
LONDON
|
£2,137
|
£1,169
|
55%
|
|
Sutton
|
LONDON
|
£2,137
|
£1,167
|
55%
|
|
Adur
|
SOUTH EAST
|
£1,665
|
£908
|
55%
|
|
Aylesbury Vale
|
SOUTH EAST
|
£1,665
|
£934
|
56%
|
|
Barking and Dagenham
|
LONDON
|
£2,137
|
£1,194
|
56%
|
|
Glasgow City
|
SCOTLAND
|
£1,584
|
£883
|
56%
|
|
Harrogate
|
YORKSHIRE AND THE HUMBER
|
£1,531
|
£853
|
56%
|
|
Stratford-on-Avon
|
WEST MIDLANDS
|
£1,546
|
£860
|
56%
|
|
Basingstoke and Deane
|
SOUTH EAST
|
£1,665
|
£925
|
56%
|
|
Harlow
|
EAST OF ENGLAND
|
£1,637
|
£939
|
57%
|
|
Cherwell
|
SOUTH EAST
|
£1,665
|
£951
|
57%
|
|
Trafford
|
NORTH WEST
|
£1,560
|
£883
|
57%
|
|
North Hertfordshire
|
EAST OF ENGLAND
|
£1,637
|
£955
|
58%
|
|
East Hampshire
|
SOUTH EAST
|
£1,665
|
£969
|
58%
|
|
Solihull
|
WEST MIDLANDS
|
£1,546
|
£896
|
58%
|
|
New Forest
|
SOUTH EAST
|
£1,665
|
£965
|
58%
|
|
South Northamptonshire
|
EAST MIDLANDS
|
£1,562
|
£903
|
58%
|
|
Crawley
|
SOUTH EAST
|
£1,665
|
£990
|
59%
|
|
Hillingdon
|
LONDON
|
£2,137
|
£1,270
|
59%
|
|
Chichester
|
SOUTH EAST
|
£1,665
|
£989
|
59%
|
|
Chelmsford
|
EAST OF ENGLAND
|
£1,637
|
£972
|
59%
|
|
Wealden
|
SOUTH EAST
|
£1,665
|
£983
|
59%
|
|
East Dorset
|
SOUTH WEST
|
£1,548
|
£935
|
60%
|
|
Dartford
|
SOUTH EAST
|
£1,665
|
£1,003
|
60%
|
|
Castle Point
|
EAST OF ENGLAND
|
£1,637
|
£985
|
60%
|
|
Lewes
|
SOUTH EAST
|
£1,665
|
£998
|
60%
|
|
Basildon
|
EAST OF ENGLAND
|
£1,637
|
£979
|
60%
|
|
Test Valley
|
SOUTH EAST
|
£1,665
|
£994
|
60%
|
|
Wycombe
|
SOUTH EAST
|
£1,665
|
£1,024
|
61%
|
|
Enfield
|
LONDON
|
£2,137
|
£1,310
|
61%
|
|
Waltham Forest
|
LONDON
|
£2,137
|
£1,309
|
61%
|
|
Vale of White Horse
|
SOUTH EAST
|
£1,665
|
£1,016
|
61%
|
|
Rochford
|
EAST OF ENGLAND
|
£1,637
|
£992
|
61%
|
|
Mid Sussex
|
SOUTH EAST
|
£1,665
|
£1,040
|
62%
|
|
South Cambridgeshire
|
EAST OF ENGLAND
|
£1,637
|
£1,022
|
62%
|
|
Lewisham
|
LONDON
|
£2,137
|
£1,324
|
62%
|
|
Bromley
|
LONDON
|
£2,137
|
£1,321
|
62%
|
|
Cotswold
|
SOUTH WEST
|
£1,548
|
£956
|
62%
|
|
Redbridge
|
LONDON
|
£2,137
|
£1,318
|
62%
|
|
Christchurch
|
SOUTH WEST
|
£1,548
|
£955
|
62%
|
|
Forest Heath
|
EAST OF ENGLAND
|
£1,637
|
£1,038
|
63%
|
|
East Hertfordshire
|
EAST OF ENGLAND
|
£1,637
|
£1,029
|
63%
|
|
West Oxfordshire
|
SOUTH EAST
|
£1,665
|
£1,042
|
63%
|
|
Uttlesford
|
EAST OF ENGLAND
|
£1,637
|
£1,048
|
64%
|
|
Watford
|
EAST OF ENGLAND
|
£1,637
|
£1,043
|
64%
|
|
Hart
|
SOUTH EAST
|
£1,665
|
£1,086
|
65%
|
|
Horsham
|
SOUTH EAST
|
£1,665
|
£1,086
|
65%
|
|
Kingston upon Thames
|
LONDON
|
£2,137
|
£1,390
|
65%
|
|
Tunbridge Wells
|
SOUTH EAST
|
£1,665
|
£1,083
|
65%
|
|
Broxbourne
|
EAST OF ENGLAND
|
£1,637
|
£1,061
|
65%
|
|
Harrow
|
LONDON
|
£2,137
|
£1,407
|
66%
|
|
Greenwich
|
LONDON
|
£2,137
|
£1,404
|
66%
|
|
Tonbridge and Malling
|
SOUTH EAST
|
£1,665
|
£1,092
|
66%
|
|
Hounslow
|
LONDON
|
£2,137
|
£1,432
|
67%
|
|
Welwyn Hatfield
|
EAST OF ENGLAND
|
£1,637
|
£1,092
|
67%
|
|
Surrey Heath
|
SOUTH EAST
|
£1,665
|
£1,110
|
67%
|
|
Newham
|
LONDON
|
£2,137
|
£1,424
|
67%
|
|
Ealing
|
LONDON
|
£2,137
|
£1,463
|
68%
|
|
City of Edinburgh
|
SCOTLAND
|
£1,584
|
£1,084
|
68%
|
|
East Lothian
|
SCOTLAND
|
£1,584
|
£1,084
|
68%
|
|
Midlothian
|
SCOTLAND
|
£1,584
|
£1,084
|
68%
|
|
Reigate and Banstead
|
SOUTH EAST
|
£1,665
|
£1,138
|
68%
|
|
Brentwood
|
EAST OF ENGLAND
|
£1,637
|
£1,119
|
68%
|
|
Dacorum
|
EAST OF ENGLAND
|
£1,637
|
£1,115
|
68%
|
|
Spelthorne
|
SOUTH EAST
|
£1,665
|
£1,142
|
69%
|
|
Exeter
|
SOUTH WEST
|
£1,548
|
£1,084
|
70%
|
|
Winchester
|
SOUTH EAST
|
£1,665
|
£1,158
|
70%
|
|
Barnet
|
LONDON
|
£2,137
|
£1,523
|
71%
|
|
Waverley
|
SOUTH EAST
|
£1,665
|
£1,203
|
72%
|
|
Brent
|
LONDON
|
£2,137
|
£1,535
|
72%
|
|
Merton
|
LONDON
|
£2,137
|
£1,530
|
72%
|
|
Haringey
|
LONDON
|
£2,137
|
£1,558
|
73%
|
|
South Oxfordshire
|
SOUTH EAST
|
£1,665
|
£1,208
|
73%
|
|
Tandridge
|
SOUTH EAST
|
£1,665
|
£1,255
|
75%
|
|
Runnymede
|
SOUTH EAST
|
£1,665
|
£1,253
|
75%
|
|
Woking
|
SOUTH EAST
|
£1,665
|
£1,271
|
76%
|
|
Southwark
|
LONDON
|
£2,137
|
£1,654
|
77%
|
|
Mole Valley
|
SOUTH EAST
|
£1,665
|
£1,288
|
77%
|
|
Cambridge
|
EAST OF ENGLAND
|
£1,637
|
£1,253
|
77%
|
|
St Albans
|
EAST OF ENGLAND
|
£1,637
|
£1,298
|
79%
|
|
Epsom and Ewell
|
SOUTH EAST
|
£1,665
|
£1,314
|
79%
|
|
Hertsmere
|
EAST OF ENGLAND
|
£1,637
|
£1,302
|
80%
|
|
Epping Forest
|
EAST OF ENGLAND
|
£1,637
|
£1,326
|
81%
|
|
Sevenoaks
|
SOUTH EAST
|
£1,665
|
£1,371
|
82%
|
|
Lambeth
|
LONDON
|
£2,137
|
£1,754
|
82%
|
|
Three Rivers
|
EAST OF ENGLAND
|
£1,637
|
£1,357
|
83%
|
|
Tower Hamlets
|
LONDON
|
£2,137
|
£1,803
|
84%
|
|
Guildford
|
SOUTH EAST
|
£1,665
|
£1,431
|
86%
|
|
Hackney
|
LONDON
|
£2,137
|
£1,834
|
86%
|
|
Chiltern
|
SOUTH EAST
|
£1,665
|
£1,426
|
86%
|
|
Richmond upon Thames
|
LONDON
|
£2,137
|
£1,857
|
87%
|
|
Wandsworth
|
LONDON
|
£2,137
|
£1,883
|
88%
|
|
Islington
|
LONDON
|
£2,137
|
£1,914
|
90%
|
|
South Bucks
|
SOUTH EAST
|
£1,665
|
£1,509
|
91%
|
|
Oxford
|
SOUTH EAST
|
£1,665
|
£1,509
|
91%
|
|
Hammersmith and Fulham
|
LONDON
|
£2,137
|
£2,117
|
99%
|
|
Elmbridge
|
SOUTH EAST
|
£1,665
|
£1,784
|
107%
|
|
City of London
|
LONDON
|
£2,137
|
£2,446
|
114%
|
|
Camden
|
LONDON
|
£2,137
|
£2,536
|
119%
|
|
Westminster
|
LONDON
|
£2,137
|
£3,018
|
141%
|
|
Kensington and Chelsea
|
LONDON
|
£2,137
|
£3,053
|
143%
|
|
Great Britain
|
N/A
|
£1,639
|
£843
|
51%
|
|
Sources
|
|
|
Average earnings
|
|
|
Salary by region for 22-29 year olds
|
|
|
Average rents
|
|
|
England
|
|
|
Scotland
|
|
|
Wales
|
|
|
50/30/20 Rule
|
|
|
Saving affordability
|
|
You May Also Enjoy
Landlords and tenants advised to work together to get through extreme heatwaves
Nearly half of UK home listings fail to sell
Lowest number of new build developments coming to market since 2017
What Every Estate Agent Should Tell Clients Before Moving Day
Breaking Property News 9/7/26