The best buy-to-let markets to make your money back the quickest
Research by independent London estate and letting agent, Benham and Reeves, has looked at where across the UK and London offers the best buy-to-let investments when it comes to rental return and the speed at which annual rent will repay the original average house price.
Benham and Reeves looked at average house price plus the cost of buy-to-let stamp duty and annual rent and ranked each area on the number of years it would take for this annual rent to recoup the cost of buying in each area and paying stamp duty.
Across the UK, Scotland offers the quickest return on investment with the annual rent returning the original asking price in 17.7 years. Northern Ireland was the second quickest at 18.9 years, followed by England (25 years) and finally Wales at 26.4 years.
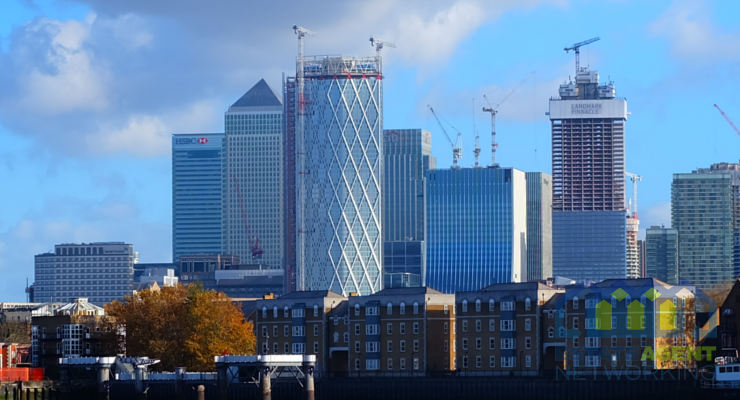
In the capital, Tower Hamlets is the best buy-to-let investment for the fastest return, with annual rental income taking 21.4 years to return the average house price and stamp duty costs of £452,821.
Barking and Dagenham (22 years), Newham (23 years), Greenwich (23.5 years) and Enfield (25.7 years were also amongst some of the best options in the capital.
With Scotland and Northern Ireland home to the quickest return on a top level, it’s no surprise that they account for the top three quickest areas in the UK, with Glasgow the quickest of them all at 13.3 years followed by Belfast at 15.8 years and Aberdeen at 17.8 years.
Nottingham was the quickest area in England to see rental income recoup the cost of buying a property at 18.4 years, followed by Newcastle at 18.5 years.
Director of Benham and Reeves, Marc von Grundherr, commented:
“Buy-to-let investment is a complicated business, even more so given the changes to the sector of late, however, the primary indicator of a good investment is always going to be the rental yield available.
While a buy-to-let investment includes all sorts of additional concerns such as contingency budgets, capital growth and so on, we wanted to highlight on a more digestible level where offers a good investment option when it comes to recouping the cost of that investment via your rental income.
What this research demonstrates is that while buy-to-let remains a lucrative business despite the Government’s attempts, it should be viewed as a long-term one and not a method for making a quick buck. For those serious about the sector whether it be as a professional or amateur landlord, it’s important to understand the commitment before diving in if you wish to see a profit.”
|
By Country
|
|||||
|
Location
|
Average house price
|
Stamp duty
|
Combined cost
|
Average rent (per year)
|
Years to recoup investment
|
|
England
|
£243,128
|
£9,656
|
£252,784
|
£10,128
|
25.0
|
|
Wales
|
£158,696
|
£4,760
|
£163,456
|
£6,182
|
26.4
|
|
Scotland
|
£149,461
|
£6,067
|
£155,528
|
£8,786
|
17.7
|
|
Northern Ireland
|
£134,811
|
£4,240
|
£139,051
|
£7,344
|
18.9
|
|
By London Borough
|
|||||
|
Location
|
Average house price
|
Stamp duty
|
Combined cost
|
Average rent (per year)
|
Years to recoup investment
|
|
Tower Hamlets
|
£428,538
|
£24,283
|
£452,821
|
£21,144
|
21.4
|
|
Barking and Dagenham
|
£300,517
|
£14,041
|
£314,558
|
£14,316
|
22.0
|
|
Newham
|
£370,525
|
£19,642
|
£390,167
|
£16,956
|
23.0
|
|
Greenwich
|
£372,803
|
£19,824
|
£392,627
|
£16,704
|
23.5
|
|
Enfield
|
£397,193
|
£21,775
|
£418,968
|
£16,284
|
25.7
|
|
Southwark
|
£499,353
|
£29,948
|
£529,301
|
£20,460
|
25.9
|
|
Brent
|
£464,522
|
£27,161
|
£491,683
|
£18,984
|
25.9
|
|
Lambeth
|
£498,431
|
£29,874
|
£528,305
|
£20,040
|
26.4
|
|
Hackney
|
£563,134
|
£35,050
|
£598,184
|
£22,272
|
26.9
|
|
Ealing
|
£471,561
|
£27,724
|
£499,285
|
£18,384
|
27.2
|
|
Lewisham
|
£397,335
|
£21,786
|
£419,121
|
£15,360
|
27.3
|
|
Wandsworth
|
£572,014
|
£35,761
|
£607,775
|
£22,260
|
27.3
|
|
Hounslow
|
£404,615
|
£22,369
|
£426,984
|
£15,552
|
27.5
|
|
Croydon
|
£359,336
|
£18,746
|
£378,082
|
£13,596
|
27.8
|
|
Havering
|
£362,698
|
£19,015
|
£381,713
|
£13,620
|
28.0
|
|
Redbridge
|
£410,799
|
£22,863
|
£433,662
|
£15,204
|
28.5
|
|
Merton
|
£514,903
|
£31,192
|
£546,095
|
£18,912
|
28.9
|
|
Sutton
|
£368,520
|
£19,481
|
£388,001
|
£13,368
|
29.0
|
|
Hillingdon
|
£410,804
|
£22,864
|
£433,668
|
£14,940
|
29.0
|
|
Richmond upon Thames
|
£657,364
|
£42,589
|
£699,953
|
£24,000
|
29.2
|
|
Bexley
|
£342,993
|
£17,439
|
£360,432
|
£12,312
|
29.3
|
|
Waltham Forest
|
£435,765
|
£24,861
|
£460,626
|
£15,636
|
29.5
|
|
Barnet
|
£515,882
|
£31,270
|
£547,152
|
£18,420
|
29.7
|
|
Harrow
|
£458,632
|
£26,690
|
£485,322
|
£16,308
|
29.8
|
|
Hammersmith and Fulham
|
£676,133
|
£44,090
|
£720,223
|
£24,060
|
29.9
|
|
Islington
|
£642,894
|
£41,431
|
£684,325
|
£22,848
|
30.0
|
|
City of Westminster
|
£912,082
|
£62,966
|
£975,048
|
£32,508
|
30.0
|
|
Haringey
|
£535,659
|
£32,852
|
£568,511
|
£18,240
|
31.2
|
|
Bromley
|
£442,388
|
£25,391
|
£467,779
|
£15,000
|
31.2
|
|
Kingston upon Thames
|
£482,969
|
£28,637
|
£511,606
|
£16,260
|
31.5
|
|
Camden
|
£774,313
|
£51,945
|
£826,258
|
£25,404
|
32.5
|
|
Kensington and Chelsea
|
£1,163,716
|
£95,033
|
£1,258,749
|
£38,076
|
33.1
|
|
City of London
|
£860,634
|
£58,850
|
£919,484
|
£26,268
|
35.0
|
|
By City
|
|||||
|
Location
|
Average house price
|
Stamp duty
|
Combined cost
|
Average rent (per year)
|
Years to recoup investment
|
|
Glasgow
|
£129,764
|
£5,190
|
£134,954
|
£10,140
|
13.3
|
|
Belfast
|
£128,386
|
£3,919
|
£132,305
|
£8,364
|
15.8
|
|
Aberdeen
|
£148,236
|
£5,994
|
£154,230
|
£8,676
|
17.8
|
|
Nottingham
|
£143,297
|
£4,664
|
£147,961
|
£8,040
|
18.4
|
|
Newcastle
|
£153,442
|
£5,172
|
£158,614
|
£8,556
|
18.5
|
|
Manchester
|
£178,039
|
£6,401
|
£184,440
|
£9,888
|
18.7
|
|
Derry City and Strabane
|
£120,651
|
£3,619
|
£124,270
|
£6,300
|
19.7
|
|
Leeds
|
£184,517
|
£6,725
|
£191,242
|
£9,144
|
20.9
|
|
Edinburgh
|
£263,868
|
£13,348
|
£277,216
|
£12,816
|
21.6
|
|
Lisburn and Castlereagh
|
£160,301
|
£5,515
|
£165,816
|
£7,608
|
21.8
|
|
Bristol
|
£274,351
|
£11,948
|
£286,299
|
£12,888
|
22.2
|
|
Liverpool
|
£131,276
|
£4,063
|
£135,339
|
£5,988
|
22.6
|
|
Sheffield
|
£161,475
|
£5,573
|
£167,048
|
£7,356
|
22.7
|
|
Birmingham
|
£186,806
|
£6,840
|
£193,646
|
£8,520
|
22.7
|
|
Swansea
|
£146,712
|
£4,401
|
£151,113
|
£6,624
|
22.8
|
|
Portsmouth
|
£207,033
|
£7,851
|
£214,884
|
£9,408
|
22.8
|
|
Southampton
|
£208,692
|
£7,934
|
£216,626
|
£9,456
|
22.9
|
|
London
|
£463,283
|
£27,062
|
£490,345
|
£20,148
|
24.3
|
|
Leicester
|
£165,258
|
£5,762
|
£171,020
|
£7,020
|
24.4
|
|
Cardiff
|
£207,531
|
£7,189
|
£214,720
|
£8,796
|
24.4
|
|
Bournemouth
|
£256,579
|
£10,526
|
£267,105
|
£10,344
|
25.8
|
|
Oxford
|
£414,972
|
£23,197
|
£438,169
|
£16,824
|
26.0
|
|
Plymouth
|
£176,973
|
£6,348
|
£183,321
|
£6,936
|
26.4
|
|
Newport
|
£179,301
|
£5,379
|
£184,680
|
£6,463
|
28.6
|
|
Cambridge
|
£436,255
|
£24,900
|
£461,155
|
£14,688
|
31.4
|
|
Sources:
|
|
|
House Price Data (Gov)
|
|
|
Private Rental Data (Gov)
|
|
|
Stamp Duty Calculators
|
|
|
Other info
|
You May Also Enjoy
Beach hut values fall for second consecutive year
Burnham’s property and land tax: what would it mean for property owners?
Homebuyers can save up to 47% by looking next door to the UK’s priciest postcodes

Your First-Time Buyer Mortgage Journey

London property values set to fall