The cost of buying new in London and the commuter belt – head to Reading for the best new build affordability

The new home specialists, Stone Real Estate, have looked at the cost of buying a new build home and how this differs across inner and outer London, and out into the London commuter belt.
Using data from the Land Registry, Stone Real Estate looked at the average new build house price across each borough in inner London, each borough of outer London, the commuter belt and how this differed, as well as the most affordable spot across each.
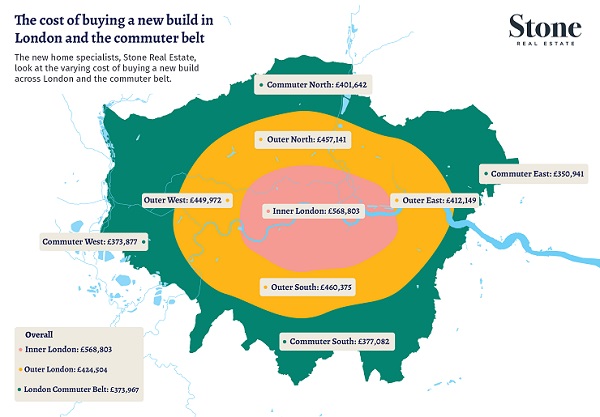
The data shows that the average cost of a new home in inner London is £568,803, however, there are pockets of relative affordability and Lewisham (£396,139), Tower Hamlets (£446,707), Newham (£481,911), Southwark (£495,554), Haringey (£500,748) and Lambeth (£531,189) all offer below-average new home house prices.
Inner London’s higher price tag is the reason that many homebuyers look from the inside out when buying in the capital and opting for London’s outer boroughs will see you save -25.4% on a new home compared to the average cost in inner London.
Again, a total of nine boroughs are home to an average new build cost offering better value with Bexley the best of the lot at just £331,654.
However, looking to London’s commuter belt provides an even more budget-friendly new build buy with the average cost of new homes surrounding London currently £373,967. This is a further 11.9% more affordable than the cost of buying new in outer London, with buying new in London as a whole costing 29% more than the commuter belt.
Reading has become a major commuter town but despite this growing demand, the average new build home still costs just £273,838. Rushmoor and Crawley also offer the chance of buying a new property within reaching distance of London for under £300k at £295,896 and £298,559 respectively.
Founder and CEO of Stone Real Estate, Michael Stone, commented:
“It’s no secret that London’s commuter belt offers a more affordable foot on the ladder but a mass exodus of London home buyers over recent years has seen the cost of buying in the commuter belt increase notably.
Despite this, there remains a number of areas that not only offer good value but do so with the additional benefit of buying a brand new home in the process.
This is one of the benefits the new homes sector brings in that developments deliver a range of properties from one to three-beds at all price points.
As a result, buyers at all stages are catered for and whether you’re buying new in central London, the capital’s peripherals or the commuter belt, you’ll find a diversity of stock at varying prices.”
|
Zone 1
|
||
|
Inner London
|
||
|
Location
|
New Build – average price 2019
|
Difference to Inner London average
|
|
Lewisham
|
£396,139
|
-30.4%
|
|
Tower Hamlets
|
£446,707
|
-21.5%
|
|
Newham
|
£481,911
|
-15.3%
|
|
Southwark
|
£495,554
|
-12.9%
|
|
Haringey
|
£500,748
|
-12.0%
|
|
Lambeth
|
£531,189
|
-6.6%
|
|
Wandsworth
|
£582,884
|
2.5%
|
|
Islington
|
£589,528
|
3.6%
|
|
Hackney
|
£593,358
|
4.3%
|
|
Hammersmith and Fulham
|
£664,969
|
16.9%
|
|
Camden
|
£837,504
|
47.2%
|
|
City of London
|
£928,713
|
63.3%
|
|
Westminster
|
£1,050,443
|
84.7%
|
|
Kensington and Chelsea
|
£1,109,745
|
95.1%
|
|
Inner London average
|
£568,803
|
|
|
London
|
£482,640
|
-18%
|
|
United Kingdom
|
£283,860
|
-100%
|
|
Zone 2
|
||
|
Outer London
|
||
|
Location
|
New Build – average price 2019
|
Difference to Outer London average
|
|
Bexley
|
£331,654
|
-21.9%
|
|
Croydon
|
£351,726
|
-17.1%
|
|
Hounslow
|
£369,048
|
-13.1%
|
|
Enfield
|
£377,060
|
-11.2%
|
|
Barking and Dagenham
|
£387,088
|
-8.8%
|
|
Havering
|
£396,726
|
-6.5%
|
|
Sutton
|
£397,522
|
-6.4%
|
|
Greenwich
|
£402,479
|
-5.2%
|
|
Harrow
|
£405,492
|
-4.5%
|
|
Hillingdon
|
£442,954
|
4.3%
|
|
Bromley
|
£454,552
|
7.1%
|
|
Brent
|
£464,005
|
9.3%
|
|
Waltham Forest
|
£467,622
|
10.2%
|
|
Ealing
|
£471,062
|
11.0%
|
|
Kingston upon Thames
|
£505,458
|
19.1%
|
|
Barnet
|
£526,739
|
24.1%
|
|
Redbridge
|
£542,799
|
27.9%
|
|
Richmond upon Thames
|
£547,270
|
28.9%
|
|
Merton
|
£592,617
|
39.6%
|
|
Outer London average
|
£424,504
|
-25.4%
|
|
Difference to Inner London average
|
-25.4%
|
|
|
London
|
£482,640
|
-12%
|
|
United Kingdom
|
£283,860
|
50%
|
|
Zone 3
|
||
|
London Commuter Belt
|
||
|
Location
|
New Build – average price 2019
|
Difference to Commuter Belt average
|
|
Reading
|
£273,838
|
-26.8%
|
|
Rushmoor
|
£295,896
|
-20.9%
|
|
Crawley
|
£298,559
|
-20.2%
|
|
Luton
|
£318,161
|
-14.9%
|
|
Southend
|
£319,298
|
-14.6%
|
|
Slough
|
£333,010
|
-11.0%
|
|
Braintree
|
£349,830
|
-6.5%
|
|
Tunbridge Wells
|
£352,528
|
-5.7%
|
|
Maidstone
|
£356,751
|
-4.6%
|
|
Watford
|
£356,928
|
-4.6%
|
|
Chelmsford
|
£362,365
|
-3.1%
|
|
Stevenage
|
£382,714
|
2.3%
|
|
Brentwood
|
£389,960
|
4.3%
|
|
Wycombe
|
£425,183
|
13.7%
|
|
Bracknell
|
£433,528
|
15.9%
|
|
Harlow
|
£544,241
|
45.5%
|
|
Guildford
|
£564,652
|
51.0%
|
|
Commuter Belt average
|
£373,967
|
-11.9%
|
|
Difference to Outer London average
|
-11.9%
|
|
|
London
|
£482,640
|
-23%
|
|
United Kingdom
|
£283,860
|
32%
|
You May Also Enjoy

Homebuyers face longer buying timelines
Breaking Property News 1/4/26

What renters and landlords need to know ahead of major rental law changes
Tackling Empty Properties

Pet-friendly rentals plunge 39%