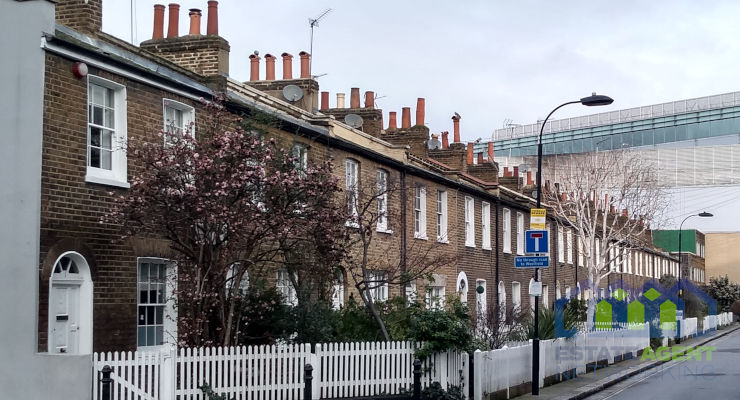
Superprime London homebuyers have vanished – here’s where high-end demand remains
The latest research by London lettings and estate agent, Benham and Reeves, has found that demand for homes listed at £10m and above across London’s prime suburbs has tumbled to just 2%; with a number of areas seeing no demand for housing at all.
Benham and Reeves looked at prime London’s property hotspots and the demand for homes listed at £2-5m, £5-10m and £10m, to see how the current pandemic is impacting homeowner appetite for London’s priciest properties.
See the full data tables for each price threshold here.
The £2-5m market
At the lower end of the capital’s prime property market, demand remains fairly robust at 15% on average.
Richmond is the most in-demand of all prime London locations at this price bracket, with 40% of all homes listed still under offer or SSTC despite the spread of the Coronavirus.
Barnes (38%), Clapham (32%), Wimbledon (29%) and Chiswick (28%) are also amongst the most popular.
The £5-10m market
Moving up a price bracket, demand drops to 10%, however, there remain a number of areas where homebuyer activity remains robust.
Again, Barnes (56%), Wimbledon (33%) and Richmond (25%) remain popular, joined by Pimilcio (19%).
However, at this price bracket demand for housing is currently non-existent in Fitzrovia, Marylebone, Maida Vale, Regents Park, Canary Wharf, Battersea, Wandsworth and Chiswick.
The £10m+ market
It is the super-prime threshold that has seen homebuyer demand take the biggest hit.
With demand as a whole at just 2%, there are a total of 13 areas where demand sits at 0%, with a further seven areas where no homes are listed above this threshold.
Highgate is the most in-demand at 8%, along with Notting Hill (6%), Knightsbridge (5%), Mayfair (4%) and Chelsea (2%).
See the full data tables for each price threshold here.
|
Prime London property demand for properties listed between £2m-£5m
|
||
|
Area
|
Prime category
|
Demand
|
|
Belgravia
|
Prime C London
|
12%
|
|
Chelsea
|
Prime C London
|
13%
|
|
Fitzrovia
|
Prime C London
|
3%
|
|
Holland Park
|
Prime C London
|
16%
|
|
Kensington
|
Prime C London
|
16%
|
|
Knightsbridge
|
Prime C London
|
15%
|
|
Marylebone
|
Prime C London
|
4%
|
|
Mayfair
|
Prime C London
|
6%
|
|
Maida Vale
|
Prime C London
|
6%
|
|
Notting Hill
|
Prime C London
|
18%
|
|
Pimlico
|
Prime C London
|
5%
|
|
Regents Park
|
Prime C London
|
5%
|
|
St John’s Wood
|
Prime C London
|
6%
|
|
Victoria
|
Prime C London
|
12%
|
|
Hampstead Garden Suburb
|
Prime NW London
|
12%
|
|
Highgate
|
Prime NW London
|
17%
|
|
Islington
|
Prime N London
|
24%
|
|
Wapping
|
Prime E London
|
0%
|
|
Canary Wharf
|
Prime E London
|
3%
|
|
Battersea
|
Prime SW London
|
19%
|
|
Clapham
|
Prime SW London
|
32%
|
|
Wandsworth
|
Prime SW London
|
19%
|
|
Wimbledon
|
Prime SW London
|
29%
|
|
Putney
|
Prime SW London
|
12%
|
|
Fulham
|
Prime SW London
|
19%
|
|
Barnes
|
Prime SW London
|
38%
|
|
Chiswick
|
Prime SW London
|
28%
|
|
Richmond
|
Prime SW London
|
40%
|
|
Average
|
15%
|
|
|
Prime London property demand for properties listed between £5m-£10m
|
||
|
Area
|
Prime category
|
Demand
|
|
Barnes
|
Prime SW London
|
56%
|
|
Wimbledon
|
Prime SW London
|
33%
|
|
Richmond
|
Prime SW London
|
25%
|
|
Pimlico
|
Prime C London
|
19%
|
|
Putney
|
Prime SW London
|
19%
|
|
Knightsbridge
|
Prime C London
|
12%
|
|
Belgravia
|
Prime C London
|
12%
|
|
Kensington
|
Prime C London
|
11%
|
|
Victoria
|
Prime C London
|
11%
|
|
Chelsea
|
Prime C London
|
11%
|
|
Holland Park
|
Prime C London
|
10%
|
|
Fulham
|
Prime SW London
|
10%
|
|
Notting Hill
|
Prime C London
|
9%
|
|
Clapham
|
Prime SW London
|
8%
|
|
Mayfair
|
Prime C London
|
7%
|
|
Highgate
|
Prime NW London
|
6%
|
|
Hampstead Garden Suburb
|
Prime NW London
|
4%
|
|
St John’s Wood
|
Prime C London
|
4%
|
|
Islington
|
Prime N London
|
3%
|
|
Fitzrovia
|
Prime C London
|
0%
|
|
Marylebone
|
Prime C London
|
0%
|
|
Maida Vale
|
Prime C London
|
0%
|
|
Regents Park
|
Prime C London
|
0%
|
|
Canary Wharf
|
Prime E London
|
0%
|
|
Battersea
|
Prime SW London
|
0%
|
|
Wandsworth
|
Prime SW London
|
0%
|
|
Chiswick
|
Prime SW London
|
0%
|
|
Wapping
|
Prime E London
|
x
|
|
Average
|
15%
|
|
|
Super-prime London property demand for properties listed at £10m and over
|
||
|
Area
|
Prime category
|
Demand
|
|
Highgate
|
Prime NW London
|
8%
|
|
Notting Hill
|
Prime C London
|
6%
|
|
Knightsbridge
|
Prime C London
|
5%
|
|
Mayfair
|
Prime C London
|
4%
|
|
Chelsea
|
Prime C London
|
2%
|
|
Kensington
|
Prime C London
|
2%
|
|
St John’s Wood
|
Prime C London
|
2%
|
|
Marylebone
|
Prime C London
|
2%
|
|
Belgravia
|
Prime C London
|
0%
|
|
Fitzrovia
|
Prime C London
|
0%
|
|
Holland Park
|
Prime C London
|
0%
|
|
Maida Vale
|
Prime C London
|
0%
|
|
Pimlico
|
Prime C London
|
0%
|
|
Regents Park
|
Prime C London
|
0%
|
|
Victoria
|
Prime C London
|
0%
|
|
Hampstead Garden Suburb
|
Prime NW London
|
0%
|
|
Islington
|
Prime N London
|
0%
|
|
Battersea
|
Prime SW London
|
0%
|
|
Wimbledon
|
Prime SW London
|
0%
|
|
Fulham
|
Prime SW London
|
0%
|
|
Richmond
|
Prime SW London
|
0%
|
|
Wapping
|
Prime E London
|
x
|
|
Canary Wharf
|
Prime E London
|
x
|
|
Clapham
|
Prime SW London
|
x
|
|
Wandsworth
|
Prime SW London
|
x
|
|
Putney
|
Prime SW London
|
x
|
|
Barnes
|
Prime SW London
|
x
|
|
Chiswick
|
Prime SW London
|
x
|
|
Average
|
15%
|
|
You May Also Enjoy
International buyer slowdown one of Prime London’s biggest challenges

Housing market hit by £21m increase in fall-through bill
Is UK Construction Stuck in a Rut?

Home sellers have a 24-hour patience threshold
Lloyds House Price Index for June 2026 – Thoughts from the Industry