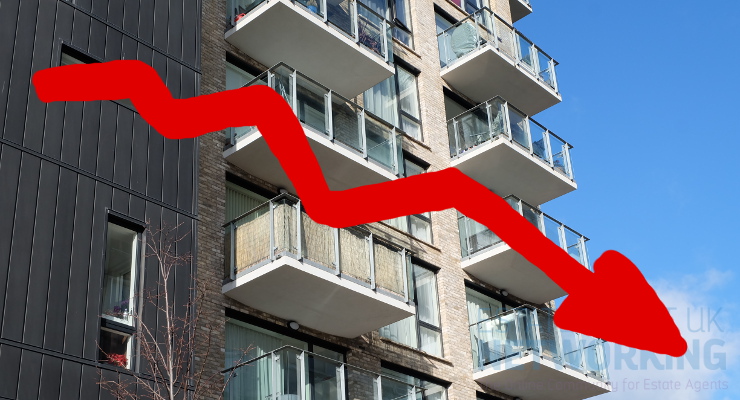
The March data shows, on average, house prices have fallen by 0.2% since February 2019
There has been an annual price rise of 1.4%, which makes the average property in the UK valued at £226,798.
England
In England, the March data shows on average, house prices have fallen by 0.5% since February 2019. The annual price rise of 1.1% takes the average property value to £243,128.
The regional data for England indicates that:
- Yorkshire and The Humber experienced the greatest monthly price rise, up by 1.8%;
- The North West saw the most significant monthly price fall, down by 1.7%;
- Yorkshire and The Humber experienced the greatest annual price rise, up by 3.6%; and
- London saw the largest annual price fall, down by 1.9%
Price change by region for England
| Region | Average price March 2019 | Monthly change % since February 2019 |
| East Midlands | £190,171 | -0.4 |
| East of England | £286,611 | -1.1 |
| London | £463,283 | -0.4 |
| North East | £123,046 | -1.1 |
| North West | £159,471 | -1.7 |
| South East | £318,491 | -0.6 |
| South West | £253,752 | -0.3 |
| West Midlands | £196,571 | -0.5 |
| Yorkshire and the Humber | £162,129 | 1.8 |
The lowest number of repossession sales in January 2019 was in the East of England.
The highest number of repossession sales in January 2019 was in the North West.
Repossession sales by volume for England
| Repossession sales | January 2019 |
| East Midlands | 41 |
| East of England | 14 |
| London | 38 |
| North East | 65 |
| North West | 131 |
| South East | 43 |
| South West | 39 |
| West Midlands | 35 |
| Yorkshire and the Humber | 83 |
| England | 489 |
Average price by property type for England
| Property type | March 2019 | March 2018 | Difference % |
| Detached | £371,759 | £363,951 | 2.1 |
| Semi-detached | £228,890 | £223,394 | 2.5 |
| Terraced | £194,560 | £194,044 | 0.3 |
| Flat/maisonette | £222,197 | £223,988 | -0.8 |
| All | £243,128 | £240,428 | 1.1 |
Funding and buyer status for England
| Transaction type | Average price March 2019 |
Annual price change % since March 2018 | Monthly price change % since February 2019 |
| Cash | £228,456 | 1.0 | -0.6 |
| Mortgage | £250,495 | 1.2 | -0.5 |
| First-time buyer | £203,695 | 0.8 | -0.5 |
| Former owner occupier | £276,268 | 1.4 | -0.5 |
Building status for England
| Building status* | Average price January 2019 | Annual price change % since January 2018 | Monthly price change % since December 2018 |
| New build | £299,932 | 0.0 | -0.9 |
| Existing resold property | £241,215 | 1.7 | -0.8 |
*Figures for the two most recent months are not being published because there are not enough new build transactions to give a meaningful result.
London
London shows, on average, house prices have fallen by 0.4% since February 2019. An annual price fall of 1.9% takes the average property value to £463,283.
Average price by property type for London
| Property type | March 2019 | March 2018 | Difference % |
| Detached | £897,848 | £890,041 | 0.9 |
| Semi-detached | £577,113 | £572,169 | 0.9 |
| Terraced | £480,041 | £487,242 | -1.5 |
| Flat/maisonette | £404,193 | £416,546 | -3.0 |
| All | £463,283 | £472,357 | -1.9 |
Funding and buyer status for London
| Transaction type | Average price March 2019 |
Annual price change % since March 2018 | Monthly price change % since February 2019 |
| Cash | £480,179 | -3.5 | -1.1 |
| Mortgage | £457,824 | -1.5 | -0.2 |
| First-time buyer | £405,658 | -2.0 | -0.1 |
| Former owner occupier | £522,105 | -1.8 | -0.7 |
Building status for London
| Building status* | Average price January 2019 | Annual price change % since January 2018 | Monthly price change % since December 2018 |
| New build | £480,874 | -3.2 | -1.5 |
| Existing resold property | £471,344 | -1.5 | -0.3 |
*Figures for the two most recent months are not being published because there are not enough new build transactions to give a meaningful result.
Wales
Wales shows, on average, house prices have not changed since February 2019. An annual price rise of 3.0% takes the average property value to £158,696.
There were 40 repossession sales for Wales in January 2019.
Average price by property type for Wales
| Property type | March 2019 | March 2018 | Difference % |
| Detached | £240,276 | £233,243 | 3.0 |
| Semi-detached | £154,015 | £148,362 | 3.8 |
| Terraced | £121,871 | £118,488 | 2.9 |
| Flat/maisonette | £112,847 | £111,686 | 1.0 |
| All | £158,696 | £154,022 | 3.0 |
Funding and buyer status for Wales
| Transaction type | Average price March 2019 | Annual price change % since March 2018 | Monthly price change % since February 2019 |
| Cash | £153,882 | 2.7 | -0.2 |
| Mortgage | £161,532 | 3.2 | 0.1 |
| First-time buyer | £136,904 | 3.0 | -0.1 |
| Former owner occupier | £184,151 | 3.1 | 0.1 |
Building status for Wales
| Building status* | Average price January 2019 | Annual price change % since January 2018 | Monthly price change % since December 2018 |
| New build | £208,740 | 3.0 | -2.1 |
| Existing resold property | £155,748 | 3.7 | -1.9 |
*Figures for the two most recent months are not being published because there are not enough new build transactions to give a meaningful result.
UK house prices rose by 1.4% in the year to March 2019, up from 1.0% in the year to February 2019.
The UK Property Transaction Statistics for March 2019 showed that on a seasonally adjusted basis, the number of transactions on residential properties with a value of £40,000 or greater was 101,830. This is 6.9% higher compared to a year ago. Between February 2019 and March 2019, transactions increased by 1.4%.
House prices grew fastest in Yorkshire and The Humber increasing by 3.6% in the year to March 2019. House prices in London fell by 1.9% over the year to March 2019, up from a fall of 2.7% in February 2019.
See the economic statement.


